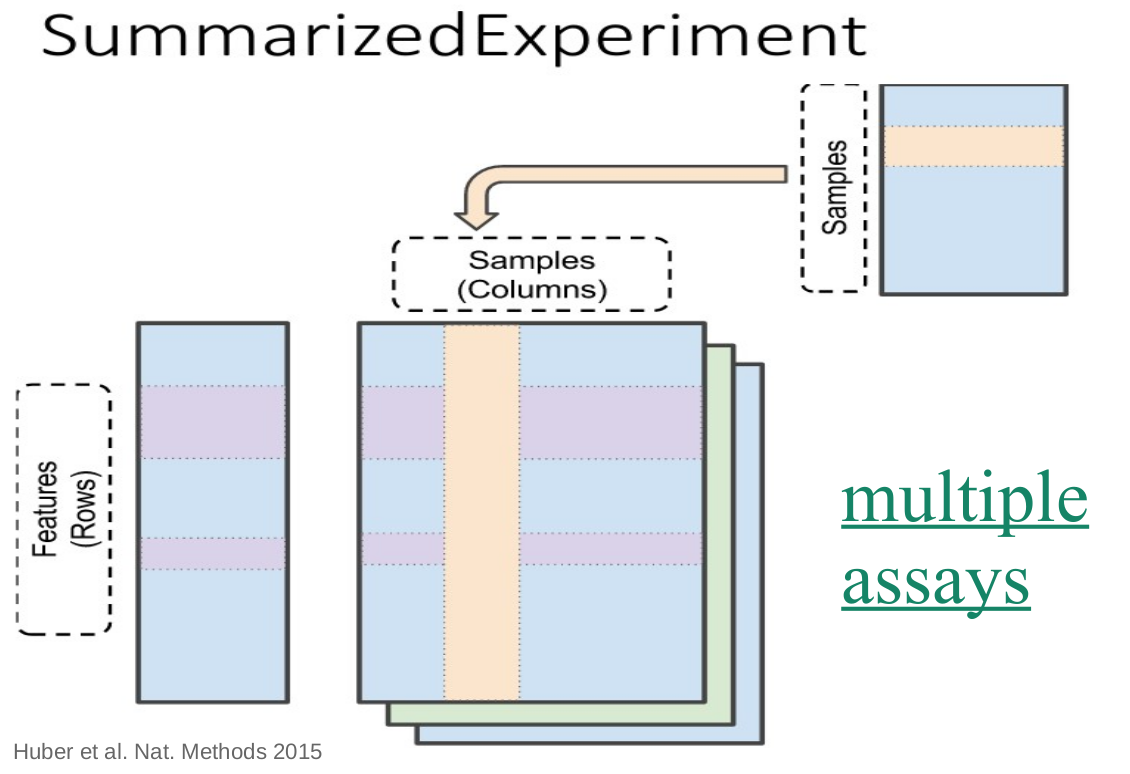
Visualizing colData
Task: visualize the abundance of a specific microbial Species against the measurement Site
Alpha diversity task
Use the available tools to assess and visualize alpha diversity, and augment colData
- Exercises 17.5.1-17.5.2
- Add Shannon diversity in colData
- Visualize diversity differences between sample groups
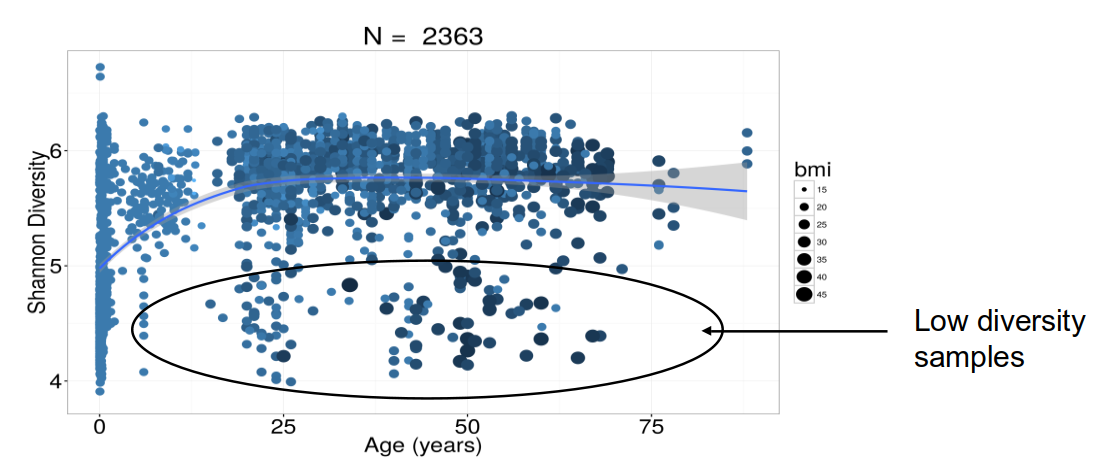
Alpha diversity & aging
Healthy & normal obese subjects.
![]()
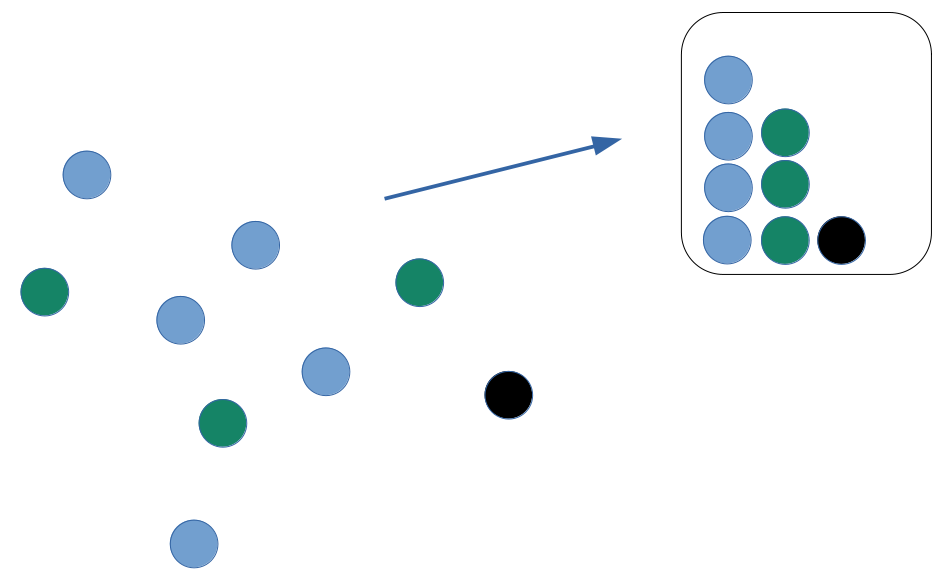
Alpha diversity
How many types?
Distribution of types?
Dominance of types?
![]()
Alpha diversity
How many types?
Distribution of types?
Dominance of types?
![]()
Alpha diversity indices
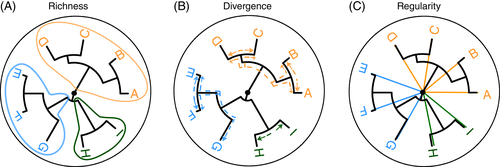
Richness
Evenness
- distribution of sizes (even or uneven?)
Diversity
- Combining richness & evenness
Dominance
Finite sampling
![]()
https://github.com/mblstamps/stamps2019/blob/master/STAMPS2019_overview_Pop.pdf
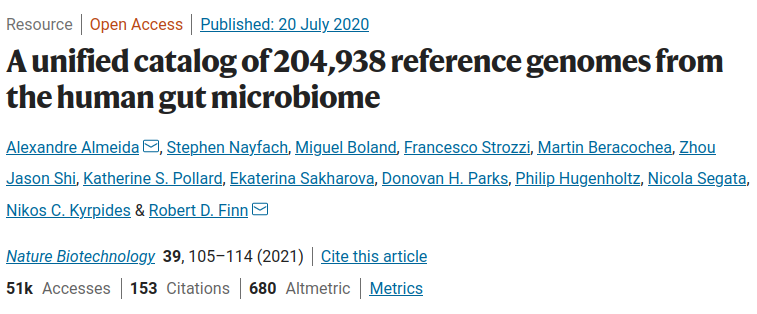
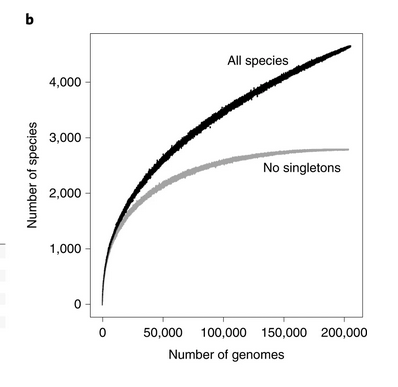
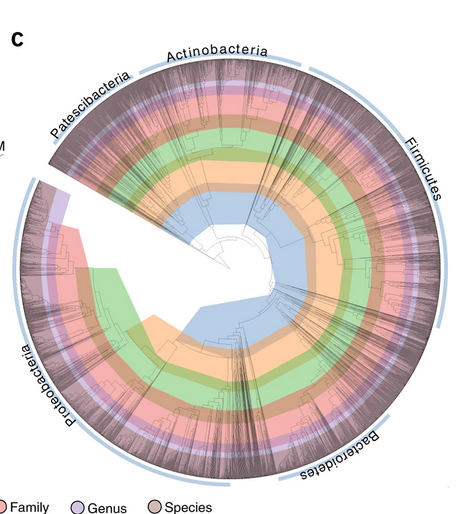
High-quality reference genomes are required for functional characterization and taxonomic assignment of the human gut microbiota.
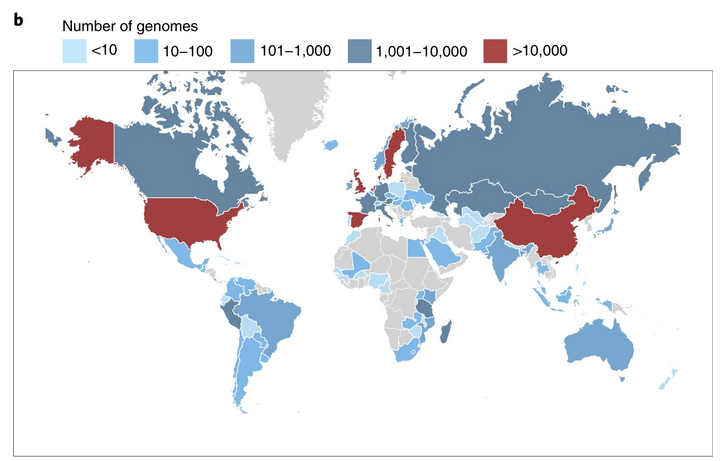
Unified Human Gastrointestinal Genome (UHGG):
4,644 gut prokaryotes (>70% lack cultured representatives)
204,938 nonredundant genomes
Encode >170 million protein sequences, collated into Unified Human Gastrointestinal Protein (UHGP) catalog.
UHGP more than doubles the number of gut proteins in comparison to those present in the Integrated Gene Catalog.
40% of the UHGP lack functional annotations
Intraspecies genomic variation analyses revealed a large reservoir of accessory genes and single-nucleotide variants, many of which are specific to individual human populations.
The UHGG and UHGP collections enable studies linking genotypes to phenotypes in the human gut microbiome.
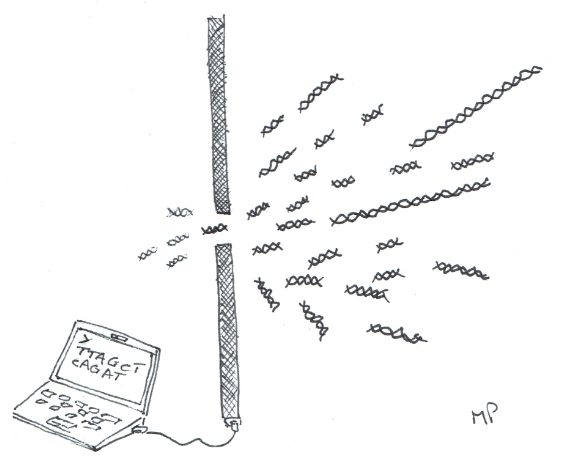
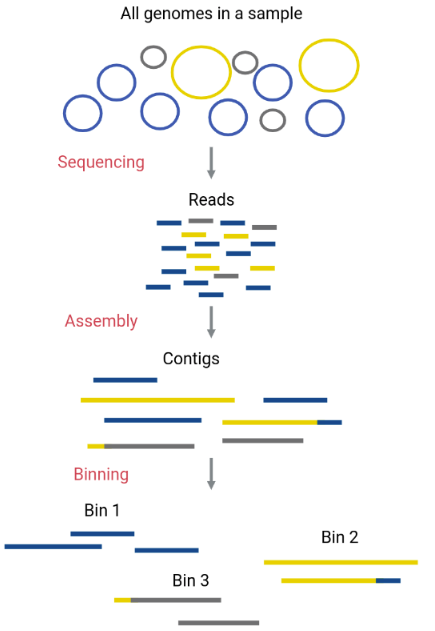
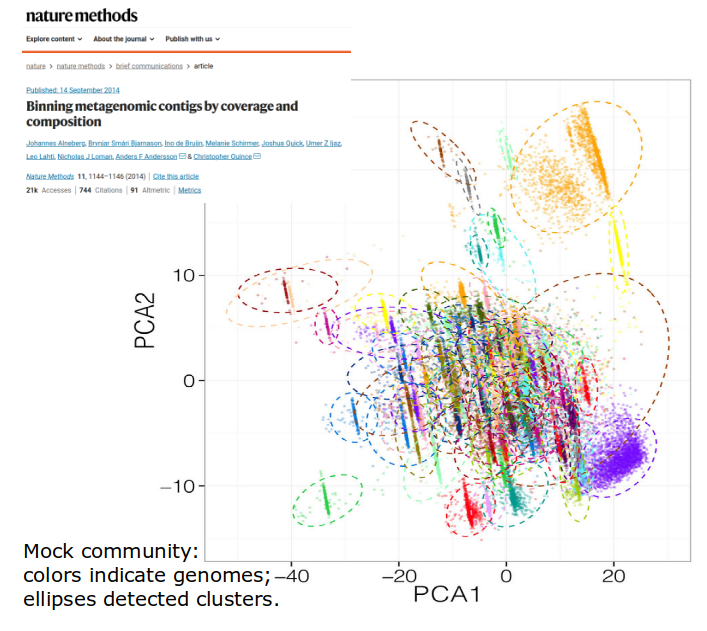
Estimating species content
Common alpha diversity indices
Phylogenetically neutral diversities:
- Richness (observed, Chao1, ACE)
- Evenness (Pielou’s evenness)
- Diversity (inverse Simpson, Shannon)
Phylogeny-aware diversities:
Phylogenetic diversity indices
![]()
![]()
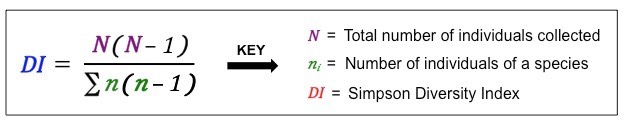
Inverse Simpson
Beware the variants:
Evenness
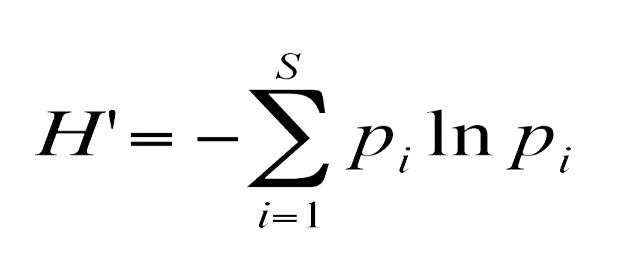
H / ln(S)
- H: Shannon diversity
- S: Species richness
Hill’s Diversity as a unifying concept
\[\begin{equation}
^qD = (\sum_i^R p_i^q )^\frac{1}{1-q}
\end{equation}\]
Hill’s alpha diversities
R: richness (number of distinct types)
pi: proportion of type I
Order of diversity:
- q = 0 : Species Richness
- q = 1 : Shannon diversity
- q = 2 : (Inverse) Simpson diversity
- q ≠ 1 : Renyi entropy
Hill’s Diversity as a unifying concept
Hill’s alpha diversities
- Richness
- inverse Simpson
- Shannon