Purpose
This report checks whether Joint-RPCA in mia and Gemelli produces the same numerical structure when both implementations receive:
- the revised IBDMDB MGX and MTX data;
- identical exported input matrices;
- equivalent filtering thresholds;
- the same training/test split; and
- the same number of components and iterations.
The full installation and execution instructions are in README.md. The computational details remain in the numbered scripts; this report contains only the small amount of code needed to display their validated outputs. No machine-specific path is fixed in this report: it uses MIA_GEMELLI_PROJECT when defined. Otherwise, it uses the filterRPCAInput_validation support directory beside this vignette.
Important
Filtering and rCLR agreement must be established before differences in Joint-RPCA outputs are interpreted.
Reproducibility specification
Run configuration
Configuration used for this run
| frequency_010 |
main |
0 |
0 |
0.1 |
3 |
5 |
10 |
42 |
1.21.6 |
25fa7bb51792566131f2bd8d07b4ebd1fde54b38 |
10 |
The configuration stores feature prevalence as an R-style proportion. Thus 0.10 in config.tsv is passed to Gemelli as 10%.
Software versions
Pinned mia, R, and platform provenance
| mia_version |
1.21.6 |
| mia_commit |
25fa7bb51792566131f2bd8d07b4ebd1fde54b38 |
| expected_mia_version |
1.21.6 |
| expected_mia_commit |
25fa7bb51792566131f2bd8d07b4ebd1fde54b38 |
| data_variant |
main |
| frequency_unit |
proportion_0_to_1 |
| r_version |
R version 4.5.3 (2026-03-11 ucrt) |
| platform |
x86_64-w64-mingw32 |
Python and Gemelli provenance
| python |
3.8.20 |
| gemelli |
0.0.12 |
| numpy |
1.23.5 |
| pandas |
2.0.3 |
| scikit-bio |
0.5.9 |
| biom-format |
2.1.13 |
| gemelli-commit |
not-recorded |
Selected IBDMDB experiments and alternative experiments
| MGX |
main |
mgx |
170 |
170 |
60 |
kingdom;phylum;class;order;family;genus;strain;original |
| MTX |
main |
mtx |
800 |
800 |
60 |
gene_function;gene_taxon |
Dimensions, sparsity, and detected numerical scale
| MGX |
170 |
60 |
0.6810784 |
0.3189216 |
non_integer_abundance |
| MTX |
800 |
60 |
0.3087292 |
0.6912708 |
non_integer_abundance |
The revised IBDMDB assays contain non-integer abundance values. Therefore this run evaluates zero/nonzero prevalence filtering. Nonzero count-depth thresholds should be validated separately with an integer-count dataset.
Main result
Stage-wise mia–Gemelli validation summary
| Configuration |
PASS |
identical fields = 11/11 |
All shared filtering, rank, iteration, split-size, and seed settings must match. |
| Filtering |
PASS |
exact retained ID sets = TRUE; minimum Jaccard = 1 |
This must match exactly before interpreting the ordination. |
| rclr preprocessing |
PASS |
minimum missingness agreement = 1; maximum absolute difference = 7.5495e-15 |
Missingness should match exactly and numeric differences should be at floating-point scale. |
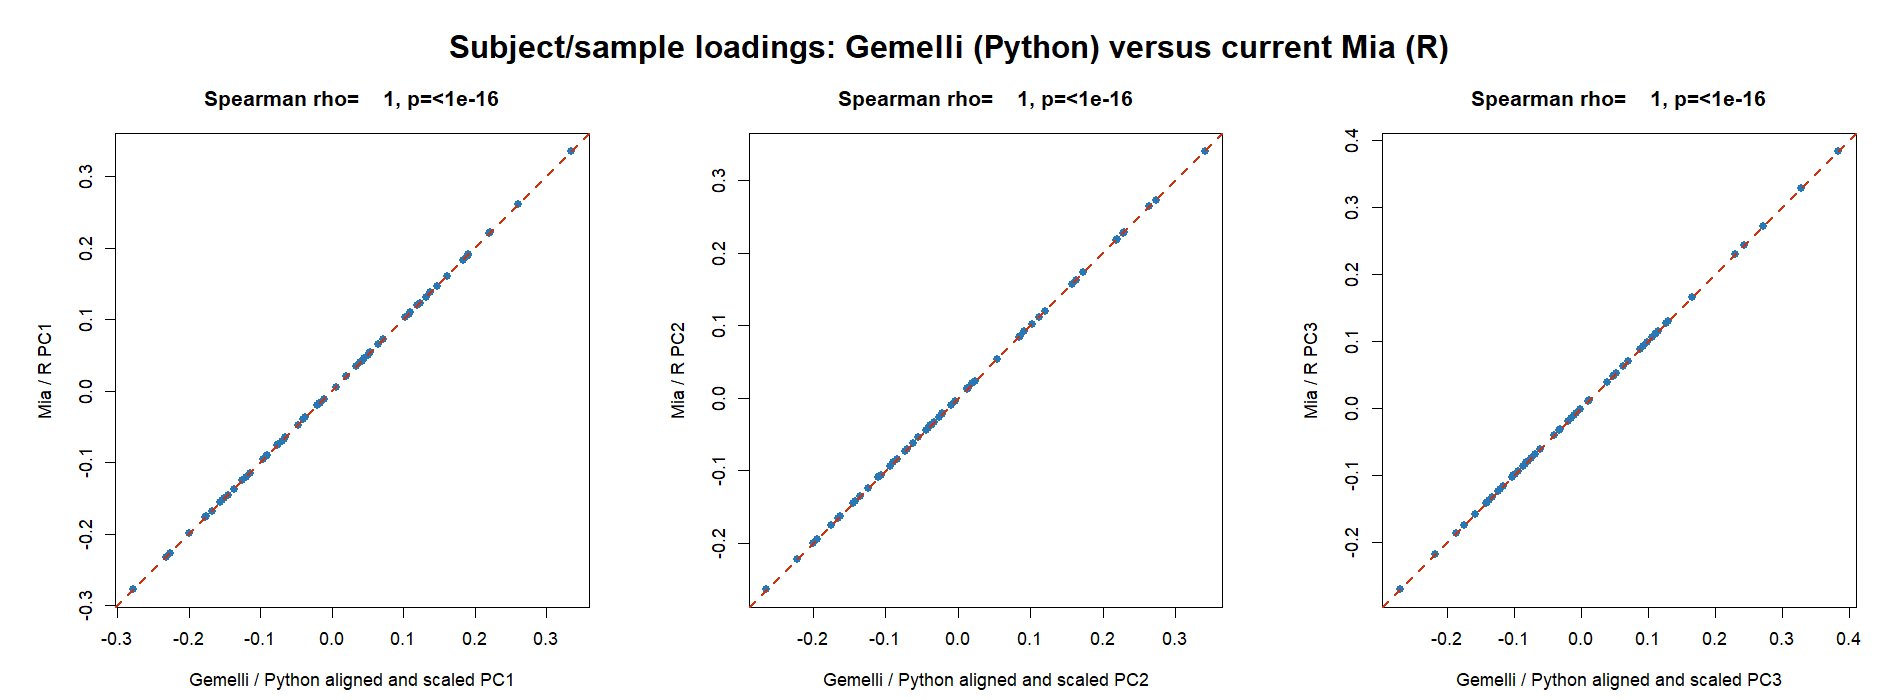
| Sample scores |
DESCRIPTIVE |
minimum aligned Spearman correlation = 1 |
Higher aligned correlations indicate similar component-wise sample placement. |
| Sample subspace |
DESCRIPTIVE |
Procrustes correlation = 1; relative error = 2.6281e-15 |
High correlation and low relative error indicate similar global sample geometry. |
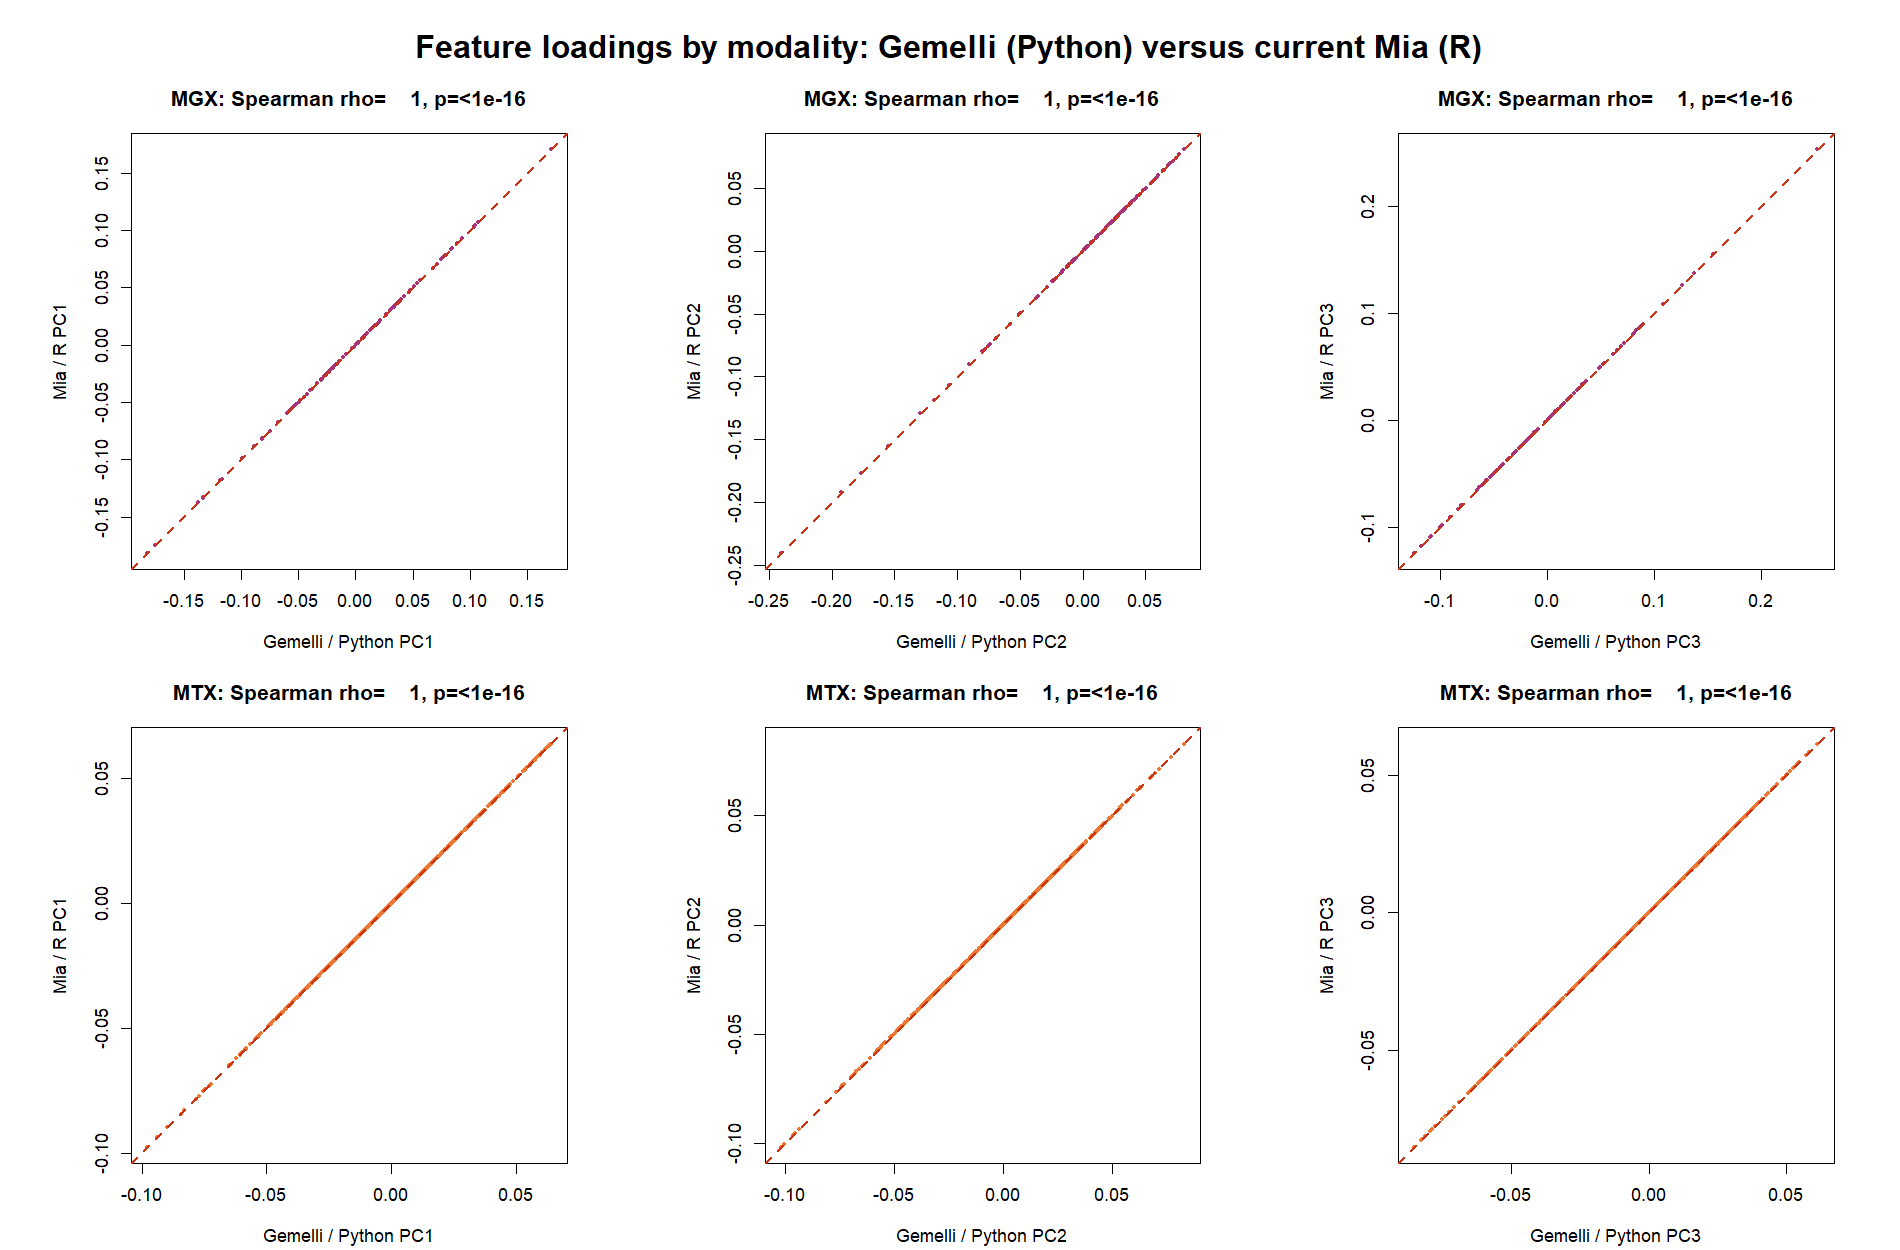
| Feature loadings |
DESCRIPTIVE |
minimum aligned Spearman correlation = 1 |
Higher aligned correlations indicate similar modality-specific feature patterns. |
| Singular values |
DESCRIPTIVE |
maximum relative difference = 6.5857e-15 |
Compare corresponding components after applying only the sample-derived sign correction. |
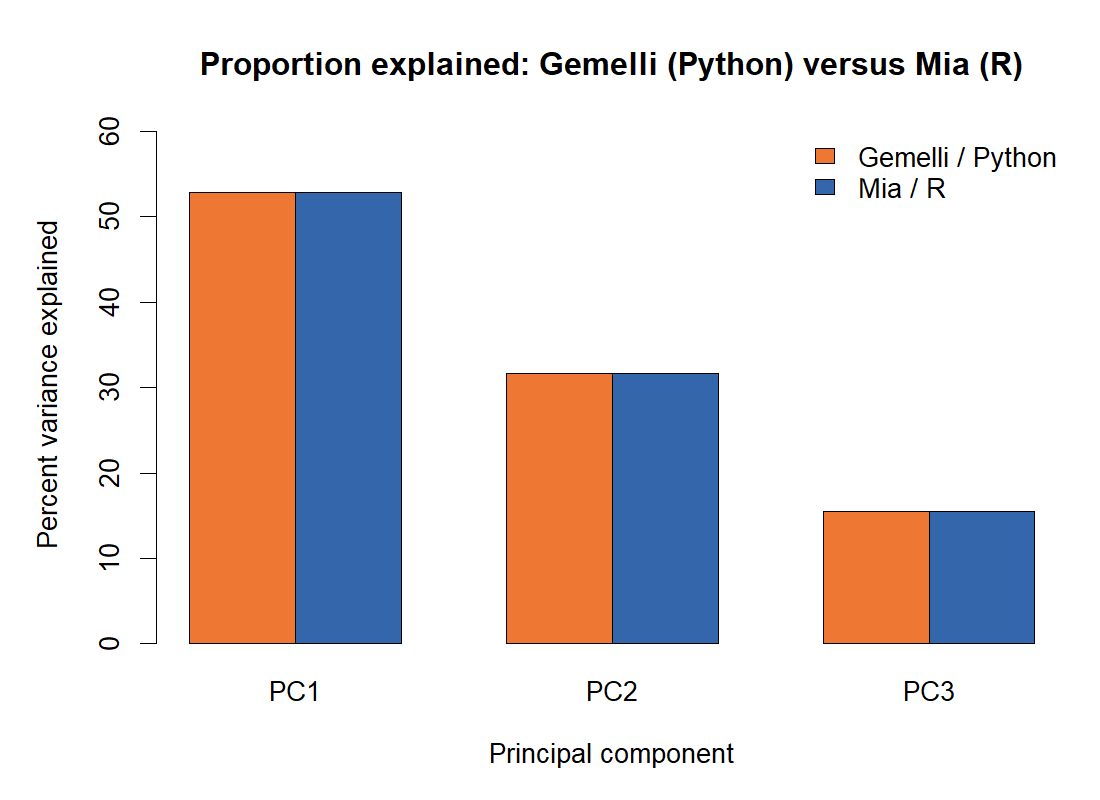
| Percent variance |
DESCRIPTIVE |
maximum absolute percentage-point difference = 1.4921e-13 |
Gemelli proportions were converted to percent before comparison. |
| Sample distances |
DESCRIPTIVE |
Spearman correlation = 1; Pearson correlation = 1 |
High correlations indicate similar pairwise sample geometry. |
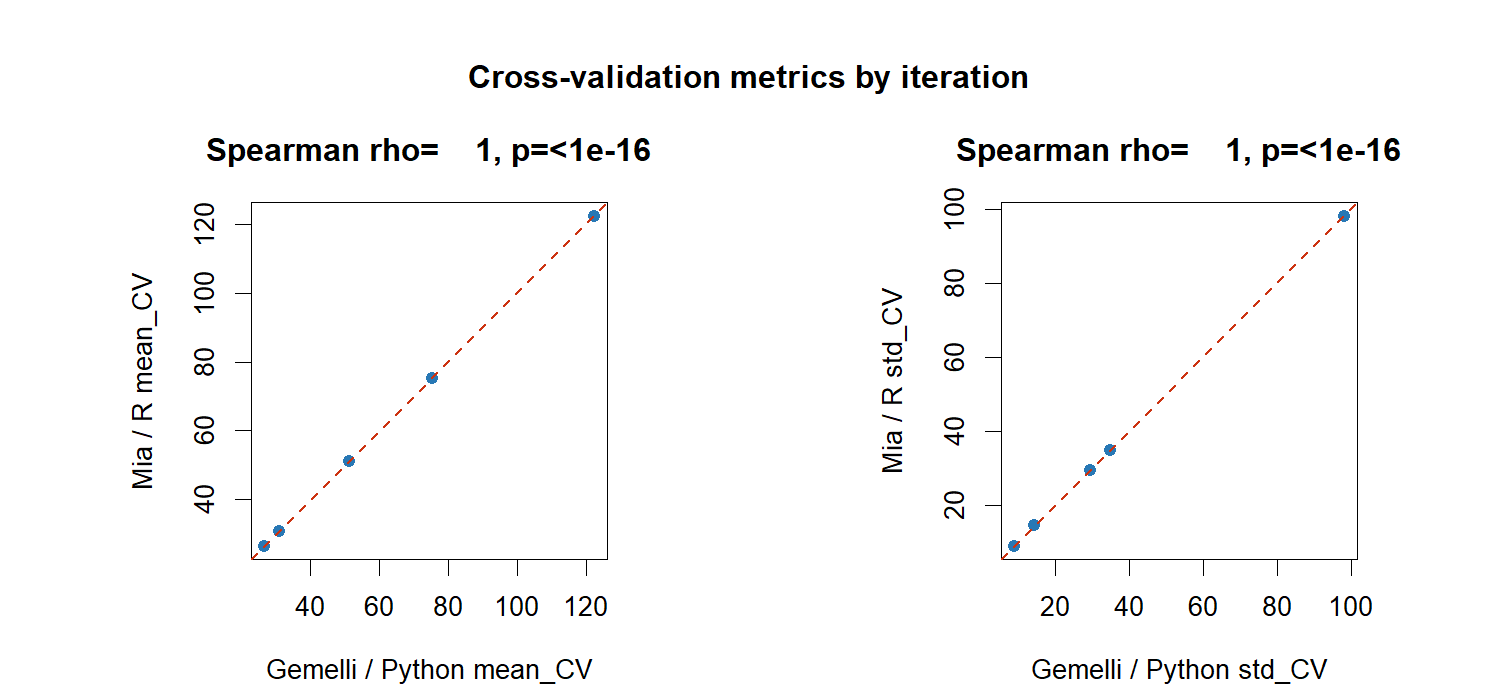
| CV trajectory |
DESCRIPTIVE |
maximum RMSE across mean/std trajectories = 1.0402e-13 |
This is diagnostic and may vary with package and linear-algebra versions. |
PASS is used only for exact or tolerance-based validation gates. DESCRIPTIVE stages report agreement metrics without imposing an arbitrary correlation threshold.
Filtering and preprocessing
Configuration parity
Configuration recorded independently by mia and Gemelli
| run_label |
frequency_010 |
frequency_010 |
TRUE |
| data_variant |
main |
main |
TRUE |
| min_sample_count |
0 |
0 |
TRUE |
| min_feature_count |
0 |
0 |
TRUE |
| min_feature_frequency |
0.1 |
0.1 |
TRUE |
| n_components |
3 |
3 |
TRUE |
| max_iterations |
5 |
5 |
TRUE |
| n_test_samples |
10 |
10 |
TRUE |
| seed |
42 |
42 |
TRUE |
| expected_mia_version |
1.21.6 |
1.21.6 |
TRUE |
| expected_mia_commit |
25fa7bb51792566131f2bd8d07b4ebd1fde54b38 |
25fa7bb51792566131f2bd8d07b4ebd1fde54b38 |
TRUE |
Filter summaries
mia filtering summary
| MGX |
170 |
119 |
119 |
60 |
60 |
60 |
| MTX |
800 |
785 |
785 |
60 |
60 |
60 |
Gemelli filtering summary
| MGX |
170 |
119 |
60 |
60 |
0.1 |
10 |
| MTX |
800 |
785 |
60 |
60 |
0.1 |
10 |
Agreement of retained feature and sample identifiers
| MGX |
119 |
119 |
TRUE |
TRUE |
1 |
60 |
60 |
TRUE |
TRUE |
1 |
| MTX |
785 |
785 |
TRUE |
TRUE |
1 |
60 |
60 |
TRUE |
TRUE |
1 |
The retained identifier sets must agree exactly. Otherwise, the two methods did not analyse the same observations.
Robust CLR
Agreement of rCLR values and missingness masks
| MGX |
119 |
60 |
1 |
0 |
0 |
| MTX |
785 |
60 |
1 |
0 |
0 |
The missingness agreement should equal one. Finite-value differences should be limited to floating-point precision.
Joint-RPCA comparison
Component alignment
Components are matched by the permutation that maximizes the absolute sample-score correlations. Signs are determined from sample scores and then applied consistently to feature loadings. Sample scores are additionally scaled for direct comparison of their numerical magnitude.
Component permutation, sign, and sample-score scale
| PC1 |
PC1 |
1 |
1 |
| PC2 |
PC2 |
-1 |
1 |
| PC3 |
PC3 |
1 |
1 |
Sample scores and sample subspace
Component-wise sample-score agreement
| PC1 |
PC1 |
1 |
1 |
1 |
1 |
| PC2 |
PC2 |
-1 |
1 |
1 |
1 |
| PC3 |
PC3 |
1 |
1 |
1 |
1 |
Orthogonal Procrustes agreement of the sample subspace
| 60 |
3 |
0 |
1 |
Feature loadings
Feature-loading agreement by modality and component
| MGX |
PC1 |
119 |
1 |
1 |
| MGX |
PC2 |
119 |
1 |
1 |
| MGX |
PC3 |
119 |
1 |
1 |
| MTX |
PC1 |
785 |
1 |
1 |
| MTX |
PC2 |
785 |
1 |
1 |
| MTX |
PC3 |
785 |
1 |
1 |
Singular values and explained variation
Singular values after component matching
| PC1 |
PC1 |
24.91052 |
24.91052 |
0 |
0 |
| PC2 |
PC2 |
19.29860 |
19.29860 |
0 |
0 |
| PC3 |
PC3 |
13.48643 |
13.48643 |
0 |
0 |
Percentage of variation explained by matched components
| PC1 |
PC1 |
52.81797 |
52.81797 |
0 |
| PC2 |
PC2 |
31.70062 |
31.70062 |
0 |
| PC3 |
PC3 |
15.48141 |
15.48141 |
0 |
Pairwise sample distances
Agreement of all unique pairwise sample distances
| 60 |
1 |
1 |
0 |
0 |
Distance agreement is invariant to component signs and therefore provides an important validation of the global sample geometry.
Cross-validation trajectory
Cross-validation values by iteration
| 1 |
122.39220 |
122.39220 |
0 |
98.112108 |
98.112108 |
0 |
| 2 |
75.20417 |
75.20417 |
0 |
29.471126 |
29.471126 |
0 |
| 3 |
51.13569 |
51.13569 |
0 |
34.989254 |
34.989254 |
0 |
| 4 |
26.48790 |
26.48790 |
0 |
14.495264 |
14.495264 |
0 |
| 5 |
30.80305 |
30.80305 |
0 |
8.989791 |
8.989791 |
0 |
Summary agreement of cross-validation trajectories
| mean_CV |
5 |
1 |
1 |
0 |
| std_CV |
5 |
1 |
1 |
0 |
Interpretation
- A filtering mismatch invalidates downstream algorithm attribution.
- An rCLR mismatch indicates preprocessing disagreement rather than a Joint-RPCA difference.
- Component-wise correlations assess latent ordering, while scale factors quantify normalization differences.
- Procrustes and pairwise-distance comparisons assess overall sample geometry.
- Cross-validation differences may also reflect numerical-library versions and should be reported rather than hidden by rescaling.
Detailed output files
The report presents every required validation result. Row-level diagnostic files—including aligned sample scores, aligned feature loadings, and pairwise distance values—remain in:
results/<run_label>/comparison/
They are retained separately because embedding thousands of diagnostic rows would make the report harder to inspect without adding scientific information.
Report environment
R version 4.6.1 (2026-06-24)
Platform: x86_64-pc-linux-gnu
Running under: Ubuntu 24.04.4 LTS

Matrix products: default
BLAS:   /usr/lib/x86_64-linux-gnu/openblas-pthread/libblas.so.3
LAPACK: /usr/lib/x86_64-linux-gnu/openblas-pthread/libopenblasp-r0.3.26.so;  LAPACK version 3.12.0

locale:
 [1] LC_CTYPE=en_US.UTF-8       LC_NUMERIC=C
 [3] LC_TIME=en_US.UTF-8        LC_COLLATE=en_US.UTF-8
 [5] LC_MONETARY=en_US.UTF-8    LC_MESSAGES=en_US.UTF-8
 [7] LC_PAPER=en_US.UTF-8       LC_NAME=C
 [9] LC_ADDRESS=C               LC_TELEPHONE=C
[11] LC_MEASUREMENT=en_US.UTF-8 LC_IDENTIFICATION=C

time zone: Etc/UTC
tzcode source: system (glibc)

attached base packages:
[1] stats     graphics  grDevices utils     datasets  methods   base

loaded via a namespace (and not attached):
 [1] compiler_4.6.1  fastmap_1.2.0   cli_3.6.6       tools_4.6.1
 [5] htmltools_0.5.9 otel_0.2.0      yaml_2.3.12     rmarkdown_2.31
 [9] knitr_1.51      jsonlite_2.0.0  xfun_0.60       digest_0.6.39
[13] rlang_1.3.0     evaluate_1.0.5