Apply a function by feature or sample group
Source:R/AllGenerics.R, R/applyByModule.R
applyByModule.RdapplyByModule provides a convenient method to apply the same operation on multiple, possibly overlapping groups of features or samples, representing for example functional microbial modules or sample categories, respectively.
applyByModule(x, ...)

# S4 method for class 'SummarizedExperiment'
applyByModule(
  x,
  .by,
  .group,
  FUN,
  min.group.size = NULL,
  meta.name = "mod_res",
  ...
)
Arguments
- x
A
SummarizedExperimentobject.- ...
Additional arguments passed to
FUN.- .by
Character scalar. Whether.groupinformation pertains the"rows"or"cols"ofx.- .group
Character vector. Names of the groups or modules by whichFUNis applied.- FUN
Function scalar. A function which takesxas the first argument and...as additional arguments. To updatexin place, usegetand notaddfunctions, as the latter will populate the altExp slot.- min.group.size
Numeric scalar. The minimum number of features or samples in a group forFUNto be applied. (Default:NULL)- meta.name
Character scalar. The name of the metadata slot where results are stored. (Default:"mod.res")
Value
x updated with results stored in the appropriate slot
depending on the given FUN.
Details
It is recommended to use get* functions to store results in the
appropriate slot of x, whereas using the add* functions applied
to features will save the results as separate experiments in the altExp slot.
In summary, function results are stored as follows:
colData: getAlpha, getDominance, getPrevalence, getCluster
reducedDims: getMDS, getNMDS, getCCA, getRDA, getLDA, getNMF, getDPCoA, calculatePCA
altExps: transformAssay and add* functions
metadata: all else (miaViz ggplot2 objects, statistical summaries, etc.)
Examples
library(bluster)
library(miaViz)
#> Loading required package: ggraph
#>
#> Attaching package: ‘miaViz’
#> The following object is masked from ‘package:scater’:
#>
#>     plotHeatmap
#> The following object is masked from ‘package:mia’:
#>
#>     plotNMDS
library(patchwork)

# Import dataset
data("Tengeler2020", package = "mia")
tse <- Tengeler2020

# Compute alpha diversity indices for each Order
tse <- applyByModule(
    tse,
    .by = "rows",
    .group = "Order",
    FUN = getAlpha,
    index = c("shannon", "faith"),
    min.group.size = 2
)

# View colData names for alpha diversity results
names(colData(tse))
#>  [1] "patient_status"             "cohort"
#>  [3] "patient_status_vs_cohort"   "sample_name"
#>  [5] "shannon_Bacteroidales"      "faith_Bacteroidales"
#>  [7] "shannon_Clostridiales"      "faith_Clostridiales"
#>  [9] "shannon_Enterobacteriales"  "faith_Enterobacteriales"
#> [11] "shannon_Erysipelotrichales" "faith_Erysipelotrichales"
#> [13] "shannon_Verrucomicrobiales" "faith_Verrucomicrobiales"

# Compute beta diversity measures for each Order
tse <- applyByModule(
    tse,
    .by = "rows",
    .group = "Order",
    FUN = getMDS,
    method = "unifrac",
    min.group.size = 2
)

# View reducedDim names for beta diversity results
reducedDimNames(tse)
#> [1] "Bacteroidales"      "Clostridiales"      "Enterobacteriales"
#> [4] "Erysipelotrichales" "Verrucomicrobiales"

# Transform assay for each Order, storing results as altExps
tse <- applyByModule(
    tse,
    .by = "rows",
    .group = "Order",
    FUN = transformAssay,
    method = "clr",
    pseudocount = TRUE
)

# View altExp names for newly transformed assays
altExpNames(tse)
#> [1] "Bacteroidales"       "Clostridiales"       "Enterobacteriales"
#> [4] "Erysipelotrichales"  "Gastranaerophilales" "Oceanospirillales"
#> [7] "Verrucomicrobiales"

# Create two example microbial modules
rowData(tse)$Mod1 <- rowData(tse)$Family == "Ruminococcaceae"
rowData(tse)$Mod2 <- rowData(tse)$Order == "Clostridiales"

# Find sample-wise most dominant genus for each module
tse <- applyByModule(
    tse,
    .by = "rows",
    .group = c("Mod1", "Mod2"),
    FUN = getDominant,
    group = "Genus"
)

# View colData names for dominance results
names(colData(tse))
#>  [1] "patient_status"             "cohort"
#>  [3] "patient_status_vs_cohort"   "sample_name"
#>  [5] "shannon_Bacteroidales"      "faith_Bacteroidales"
#>  [7] "shannon_Clostridiales"      "faith_Clostridiales"
#>  [9] "shannon_Enterobacteriales"  "faith_Enterobacteriales"
#> [11] "shannon_Erysipelotrichales" "faith_Erysipelotrichales"
#> [13] "shannon_Verrucomicrobiales" "faith_Verrucomicrobiales"
#> [15] "dominant_Mod1"              "dominant_Mod2"

# Cluster samples by features for each module
tse <- applyByModule(
    tse,
    .by = "rows",
    .group = c("Mod1", "Mod2"),
    FUN = getCluster,
    assay.type = "counts",
    by = "cols",
    BLUSPARAM = KmeansParam(centers = 3)
)

# View colData names for clustering results
names(colData(tse))
#>  [1] "patient_status"             "cohort"
#>  [3] "patient_status_vs_cohort"   "sample_name"
#>  [5] "shannon_Bacteroidales"      "faith_Bacteroidales"
#>  [7] "shannon_Clostridiales"      "faith_Clostridiales"
#>  [9] "shannon_Enterobacteriales"  "faith_Enterobacteriales"
#> [11] "shannon_Erysipelotrichales" "faith_Erysipelotrichales"
#> [13] "shannon_Verrucomicrobiales" "faith_Verrucomicrobiales"
#> [15] "dominant_Mod1"              "dominant_Mod2"
#> [17] "cluster_Mod1"               "cluster_Mod2"

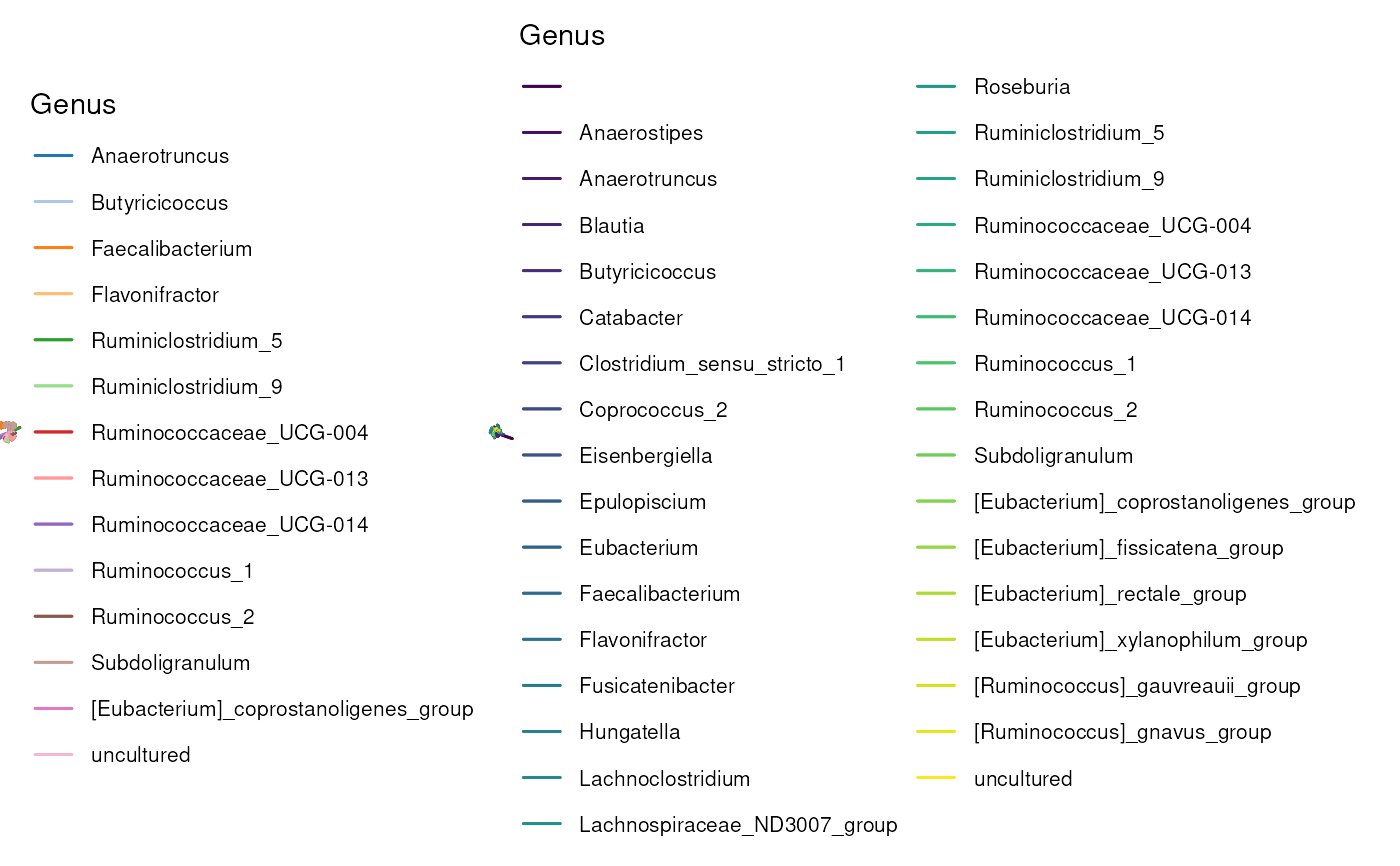
# Plot tree for each module, specifying metadata name
tse <- applyByModule(
    tse,
    .by = "rows",
    .group = c("Mod1", "Mod2"),
    FUN = plotRowTree,
    edge.colour.by = "Genus",
    meta.name = "tree_plots"
)

# Visualize module-wise abundance plots
metadata(tse)$tree_plots |>
    wrap_plots()