Canonical Correspondence Analysis and Redundancy Analysis
Source:R/AllGenerics.R, R/runCCA.R
runCCA.RdThese functions perform Canonical Correspondence Analysis on data stored
in a SummarizedExperiment.
getCCA(x, ...)

addCCA(x, ...)

getRDA(x, ...)

addRDA(x, ...)

calculateCCA(x, ...)

runCCA(x, ...)

# S4 method for class 'ANY'
getCCA(x, formula, data, ...)

# S4 method for class 'SummarizedExperiment'
getCCA(
  x,
  formula = NULL,
  col.var = variables,
  variables = NULL,
  test.signif = TRUE,
  assay.type = assay_name,
  assay_name = exprs_values,
  exprs_values = "counts",
  ...
)

# S4 method for class 'SingleCellExperiment'
addCCA(x, altexp = NULL, name = "CCA", ...)

calculateRDA(x, ...)

runRDA(x, ...)

# S4 method for class 'ANY'
getRDA(x, formula, data, ...)

# S4 method for class 'SummarizedExperiment'
getRDA(
  x,
  formula = NULL,
  col.var = variables,
  variables = NULL,
  test.signif = TRUE,
  assay.type = assay_name,
  assay_name = exprs_values,
  exprs_values = NULL,
  dis.name = NULL,
  ...
)

# S4 method for class 'SingleCellExperiment'
addRDA(x, altexp = NULL, name = "RDA", ...)
Arguments
- x
- ...
additional arguments passed to vegan::cca or vegan::dbrda and other internal functions.
methoda dissimilarity measure to be applied in dbRDA and possible following homogeneity test. (Default:"euclidean")scale:Logical scalar. Should the expression values be standardized?scaleis disabled when using*RDAfunctions. Please scale before performing RDA. (Default:TRUE)na.action:function. Action to take when missing values for any of the variables informulaare encountered. (Default:na.fail)fullLogical scalar. Should all the results from the significance calculations be returned. WhenFALSE, only summary tables are returned. (Default:FALSE)homogeneity.test:Character scalar. Specifies the significance test used to analysevegan::betadisperresults. Options include 'permanova' (vegan::permutest), 'anova' (stats::anova) and 'tukeyhsd' (stats::TukeyHSD). (Default:"permanova")permutations:Integer scalar. Specifies the number of permutations for significance testing invegan::anova.cca. (Default:999)subset.result:Logical result. Specifies whether to subsetxto match the result if some samples were removed during calculation. (Default:TRUE)binary:Logical scalar. Whether to perform presence/absence transformation before dissimilarity calculation. For Jaccard index the default isTRUE. For other dissimilarity metrics, please seevegdist.
- formula
formula. Ifxis aSummarizedExperimenta formula can be supplied. Based on the right-hand side of the given formulacolDatais subset tocol.var.col.varandformulacan be missing, which turns the CCA analysis into a CA analysis and dbRDA into PCoA/MDS.- data
data.frameor coarcible to one. The covariance table including covariates defined byformula.- col.var
Character scalar. Whenxis aSummarizedExperiment,col.varcan be used to specify variables fromcolData.- variables
Deprecated. Use
col.varinstead.- test.signif
Logical scalar. Should the PERMANOVA and analysis of multivariate homogeneity of group dispersions be performed. (Default:TRUE)- assay.type
Character scalar. Specifies the name of assay used in calculation. (Default:NULL)- assay_name
Deprecated. Use
assay.typeinstead.- exprs_values
Deprecated. Use
assay.typeinstead.- altexp
Character scalarorinteger scalar. Specifies an alternative experiment containing the input data.- name
Character scalar. A name for thereducedDim()where results will be stored. (Default:"CCA")- dis.name
Character scalar. Specifies the name of dissimilarity matrix frommetadataslot used in calculation. (Default:NULL)
Value
For getCCA a matrix with samples as rows and CCA dimensions as
columns. Attributes include output from scores,
eigenvalues, the cca/rda object and significance analysis
results.
For addCCA a modified x with the results stored in
reducedDim as the given name.
Details
*CCA functions utilize vegan:cca and *RDA functions
vegan:dbRDA. By default, dbRDA is done with euclidean distances, which
is equivalent to RDA. col.var and formula can be missing,
which turns the CCA analysis into a CA analysis and dbRDA into PCoA/MDS.
Significance tests are done with vegan:anova.cca (PERMANOVA). Group
dispersion, i.e., homogeneity within groups is analyzed with
vegan::betadisper
(multivariate homogeneity of groups dispersions
(variances)) and statistical significance of homogeneity is tested with a
test specified by homogeneity.test parameter.
Examples
library(miaViz)
#> Loading required package: ggraph
#>
#> Attaching package: ‘miaViz’
#> The following object is masked from ‘package:mia’:
#>
#>     plotNMDS
data("enterotype", package = "mia")
tse <- enterotype

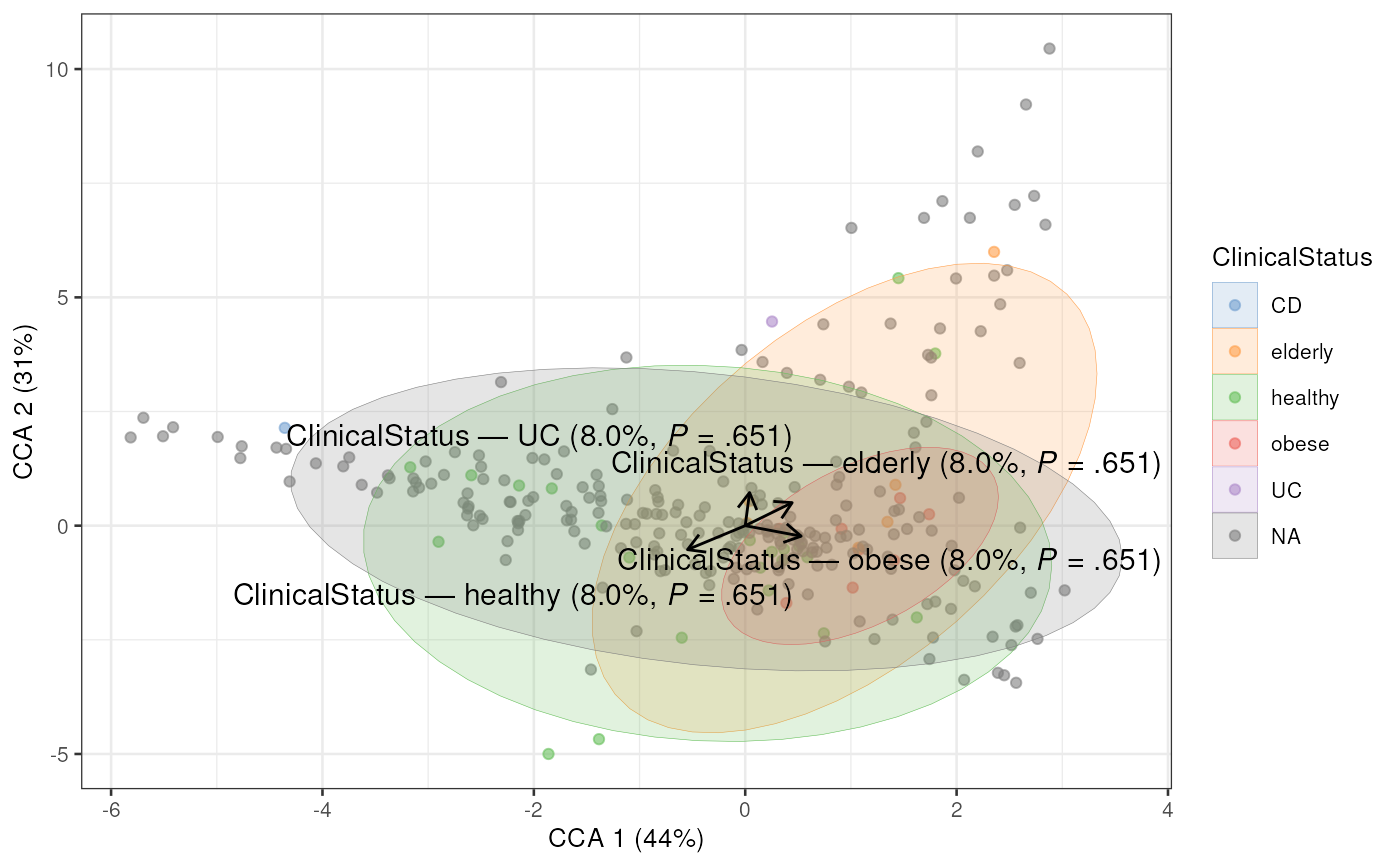
# Perform CCA and exclude any sample with missing ClinicalStatus
tse <- addCCA(
    tse,
    assay.type = "counts",
    formula = data ~ ClinicalStatus,
    na.action = na.exclude
    )

# Plot CCA
plotCCA(tse, "CCA", colour_by = "ClinicalStatus")
#> Warning: Using `size` aesthetic for lines was deprecated in ggplot2 3.4.0.
#> ℹ Please use `linewidth` instead.
#> ℹ The deprecated feature was likely used in the miaViz package.
#>   Please report the issue at <https://github.com/microbiome/miaViz/issues>.
#> Too few points to calculate an ellipse
#> Too few points to calculate an ellipse


# Fetch significance results
getReducedDimAttribute(tse, dimred = "CCA", name = "significance")
#> $permanova
#>                Df ChiSquare         F Pr(>F) Total variance Explained variance
#> Model           4  0.150386 0.7379888  0.655         1.8825         0.07988631
#> ClinicalStatus  4  0.150386 0.7379888  0.644         1.8825         0.07988631
#> Residual       34  1.732114        NA     NA         1.8825         0.92011369
#>
#> $homogeneity
#>                Df    Sum Sq    Mean Sq        F N.Perm Pr(>F) Total variance
#> ClinicalStatus  4 0.2184213 0.05460533 1.757098    999  0.141       1.275039
#>                Explained variance
#> ClinicalStatus          0.1713056
#>

tse <- transformAssay(tse, method = "relabundance")

# Specify dissimilarity measure
tse <- addRDA(
    tse,
    formula = data ~ ClinicalStatus,
    assay.type = "relabundance",
    method = "bray",
    name = "RDA_bray",
    na.action = na.exclude
    )

# To scale values when using *RDA functions, use
# transformAssay(MARGIN = "features", ...)
tse <- transformAssay(tse, method = "standardize", MARGIN = "features")

# Data might include taxa that do not vary. Remove those because after
# z-transform their value is NA
tse <- tse[rowSums(is.na(assay(tse, "standardize"))) == 0, ]

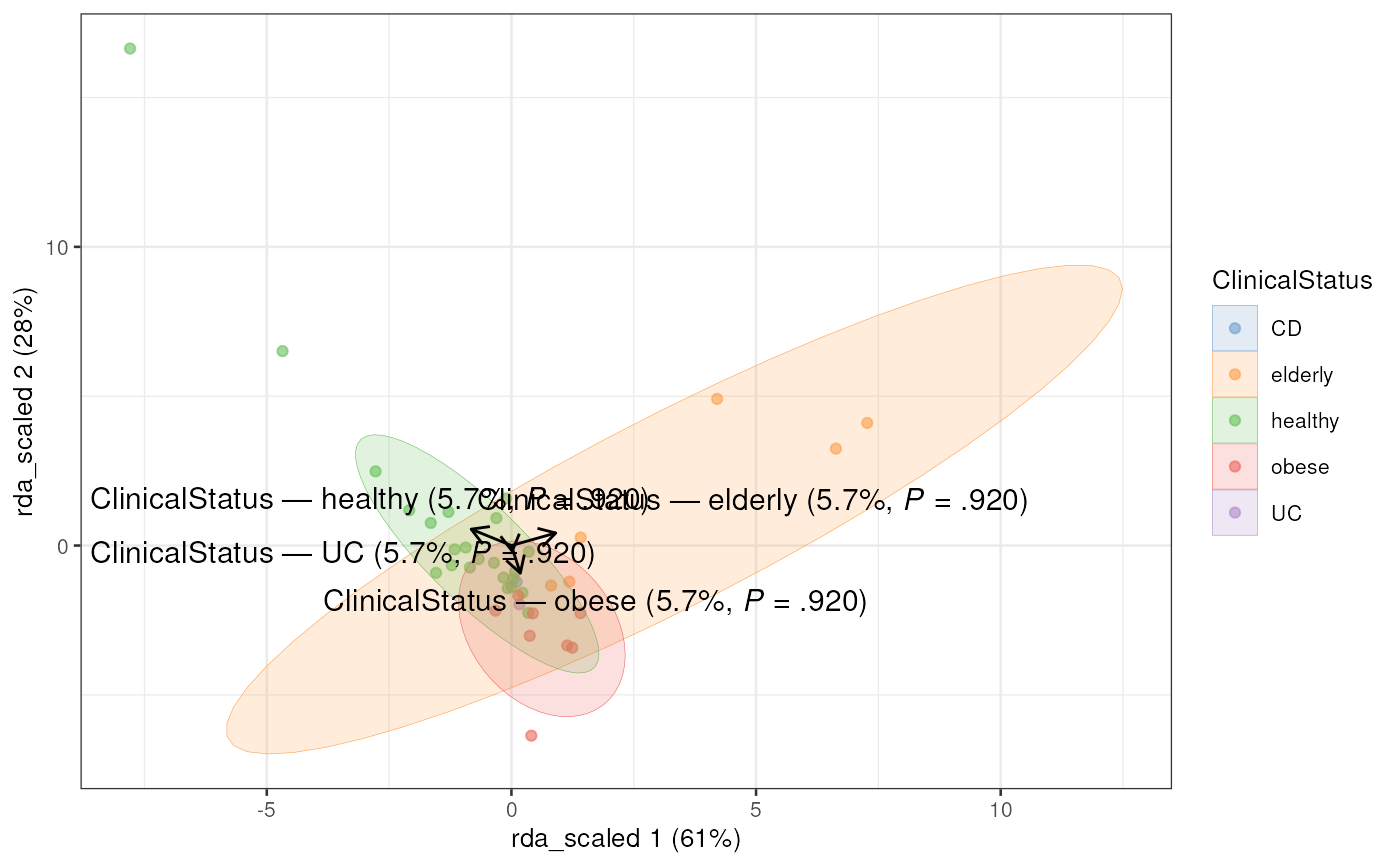
# Calculate RDA
tse <- addRDA(
   tse,
   formula = data ~ ClinicalStatus,
   assay.type = "standardize",
   name = "rda_scaled",
   na.action = na.omit
   )
#> Warning: The following samples are removed from the data as they are not includes in dimension reduction results (see 'subset.result' parameter): 'DA.AD.1T', 'DA.AD.3T', 'MH0001', 'MH0002', 'MH0003', 'MH0004', 'MH0005', 'MH0006', 'MH0007', 'MH0008', 'MH0009', 'MH0010', 'MH0011', 'MH0012', 'MH0013', 'MH0014', 'MH0015', 'MH0016', 'MH0017', 'MH0018', 'MH0019', 'MH0020', 'MH0021', 'MH0022', 'MH0023', 'MH0024', 'MH0025', 'MH0026', 'MH0027', 'MH0028', 'MH0030', 'MH0031', 'MH0032', 'MH0033', 'MH0034', 'MH0035', 'MH0036', 'MH0037', 'MH0038', 'MH0039', 'MH0040', 'MH0041', 'MH0042', 'MH0043', 'MH0044', 'MH0045', 'MH0046', 'MH0047', 'MH0048', 'MH0049', 'MH0050', 'MH0051', 'MH0052', 'MH0053', 'MH0054', 'MH0055', 'MH0056', 'MH0057', 'MH0058', 'MH0059', 'MH0060', 'MH0061', 'MH0062', 'MH0063', 'MH0064', 'MH0065', 'MH0066', 'MH0067', 'MH0068', 'MH0069', 'MH0070', 'MH0071', 'MH0072', 'MH0073', 'MH0074', 'MH0075', 'MH0076', 'MH0077', 'MH0078', 'MH0079', 'MH0080', 'MH0081', 'MH0082', 'MH0083', 'MH0084', 'MH0085', 'MH0086', 'TS1_V2', 'TS10_V2', 'TS100_V2', 'TS101.2_V2', 'TS103_V2', 'TS104_V2', 'TS105_V2', 'TS106_V2', 'TS107_V2', 'TS109_V2', 'TS11_V2', 'TS110_V2', 'TS111_V2', 'TS115_V2', 'TS116_V2', 'TS117_V2', 'TS118_V2', 'TS119_V2', 'TS12_V2', 'TS120_V2', 'TS124_V2', 'TS125_V2', 'TS126_V2', 'TS127_V2', 'TS128_V2', 'TS129_V2', 'TS13_V2', 'TS130_V2', 'TS131_V2', 'TS132_V2', 'TS133_V2', 'TS134_V2', 'TS135_V2', 'TS136_V2', 'TS137_V2', 'TS138_V2', 'TS139_V2', 'TS14_V2', 'TS140_V2', 'TS141_V2', 'TS142_V2', 'TS143_V2', 'TS144_V2', 'TS145_V2', 'TS146_V2', 'TS147_V2', 'TS148_V2', 'TS149_V2', 'TS15_V2', 'TS150_V2', 'TS151_V2', 'TS152_V2', 'TS153_V2', 'TS154.2_V2', 'TS155_V2', 'TS156_V2', 'TS16_V2', 'TS160_V2', 'TS161_V2', 'TS162_V2', 'TS163_V2', 'TS164_V2', 'TS165_V2', 'TS166_V2', 'TS167_V2', 'TS168_V2', 'TS169_V2', 'TS17_V2', 'TS170_V2', 'TS178_V2', 'TS179_V2', 'TS180_V2', 'TS181_V2', 'TS182_V2', 'TS183_V2', 'TS184_V2', 'TS185_V2', 'TS186_V2', 'TS19_V2', 'TS190_V2', 'TS191_V2', 'TS192_V2', 'TS193_V2', 'TS194_V2', 'TS195_V2', 'TS2_V2', 'TS20_V2', 'TS21_V2', 'TS22_V2', 'TS23_V2', 'TS25_V2', 'TS26_V2', 'TS27_V2', 'TS28_V2', 'TS29_V2', 'TS3_V2', 'TS30_V2', 'TS31_V2', 'TS32_V2', 'TS33_V2', 'TS34_V2', 'TS35_V2', 'TS37_V2', 'TS38_V2', 'TS39_V2', 'TS4_V2', 'TS43_V2', 'TS44_V2', 'TS49_V2', 'TS5_V2', 'TS50_V2', 'TS51_V2', 'TS55_V2', 'TS56_V2', 'TS57_V2', 'TS6_V2', 'TS61_V2', 'TS62_V2', 'TS63_V2', 'TS64_V2', 'TS65_V2', 'TS66_V2', 'TS67_V2', 'TS68_V2', 'TS69_V2', 'TS7_V2', 'TS70_V2', 'TS71_V2', 'TS72_V2', 'TS73_V2', 'TS74_V2', 'TS75_V2', 'TS76_V2', 'TS77_V2', 'TS78_V2', 'TS8_V2', 'TS82_V2', 'TS83_V2', 'TS84_V2', 'TS85_V2', 'TS86_V2', 'TS87_V2', 'TS88_V2', 'TS89_V2', 'TS9_V2', 'TS90_V2', 'TS91_V2', 'TS92_V2', 'TS94_V2', 'TS95_V2', 'TS96_V2', 'TS97_V2', 'TS98_V2', 'TS99.2_V2'

# Plot RDA
plotRDA(tse, "rda_scaled", colour_by = "ClinicalStatus")
#> Too few points to calculate an ellipse
#> Too few points to calculate an ellipse


# A common choice along with PERMANOVA is ANOVA when statistical significance
# of homogeneity of groups is analysed. Moreover, full significance test
# results can be returned.
tse <- transformAssay(tse, method = "clr", pseudocount = 1)
tse <- addRDA(
    tse,
    assay.type = "clr",
    formula = data ~ ClinicalStatus,
    homogeneity.test = "anova",
    full = TRUE
    )

# Example showing how to pass extra parameters, such as 'permutations',
# to anova.cca
tse <- addRDA(
    tse,
    assay.type = "clr",
    formula = data ~ ClinicalStatus,
    permutations = 500
    )

# In dbRDA, dissimilarity matrix is calculated internally which is
# computationally heavy operation. If you have large number of samples, and
# you want to fit multiple dbRDA models, you might want to consider
# pre-calculation of dissimilarity matrix as the same matrix will be used for
# all models. You can then run dbRDA with the pre-calculated dissimilarity
# avoiding redundant dissimilarity calculations.
tse <- addDissimilarity(tse, assay.type = "relabundance", method = "bray")
tse <- addRDA(
    tse,
    formula = data ~ ClinicalStatus,
    dis.name = "bray",
    name = "RDA_precalc_bray",
    na.action = na.exclude
    )