Create boxplot of assay, rowData or colData.
Source: R/AllGenerics.R, R/plotBoxplot.R
plotBoxplot.RdThis methods visualizes abundances or variables from rowData or
colData.
plotBoxplot(object, ...)

# S4 method for class 'SummarizedExperiment'
plotBoxplot(
  object,
  assay.type = NULL,
  row.var = NULL,
  col.var = NULL,
  x = NULL,
  features = NULL,
  group.by = NULL,
  ...
)
Arguments
- object
a
SummarizedExperimentobject.- ...
Additional parameters for plotting.
point.offset:Character scalar. Utilized method for offsetting points. The available options include:"center","compactswarm","hex","square","swarm"(seebeeswarm::beeswarm()for details),"frowney","maxout","minout","pseudorandom","quasirandom","smiley","tukey","tukeyDense"(seevipor::offsetSingleGroup()for details),"jitter", and"none", If"none", ofsetting is not applied. (Default:"jitter")colour.by:NULLorcharacter scalar. Specifies a variable fromcolData(x)orrowData(x)which is used to colour observations. (Default:NULL)fill.by:NULLorcharacter scalar. Specifies a variable fromcolData(x)orrowData(x)which is used to colour observations. (Default:NULL)size.by:NULLorcharacter scalar. Specifies a variable fromcolData(x)orrowData(x)which is used to scale observation points. (Default:NULL)shape.by:NULLorcharacter scalar. Specifies a variable fromcolData(x)orrowData(x)which is used to shape observation points. (Default:NULL)facet.by:NULLorcharacter scalar. Specifies a variable fromcolData(x)orrowData(x)which is used to facet or group observations. (Default:NULL)pair.by:NULLorcharacter scalar. Specifies a variable fromcolData(x)which is used to pair observation points. (Default:NULL)add.chance:Logical scalar. Whether to visualize chance of paired observations by the color of line. (Default:FALSE)add.box:Logical scalar. Whether to add a boxplot layout. (Default:TRUE)add.points:Logical scalar. Whether to add a point layout. (Default:TRUE)add.proportion:Logical scalar. Whether to add a barplot layout denoting the proportion of observations abovethreshold. (Default:FALSE)add.threshold:Logical scalar. Whether to add athresholdas horizontal line whenadd.proportion = TRUEis specified. (Default:TRUE)threshold:Numeric scalar. Specifies threshold for the barplots. (Default:0)jitter.width:Numeric scalar. Width of jitter. (Default:0.3)jitter.height:Numeric scalar. Height of jitter. (Default:0)dodge.width:Numeric scalar. Width of dodge. How far apart the groups are plotted? (Default:0)beeswarm.corral:Character scalar. Beeswarm's "corral" method. Fed to functionbeeswarm::beeswarm(). (Default:"none")scales:Character scalar. Adjust scales of facets. (Default:"fixed")box.alpha:Numeric scalar. Transparency of the boxplot layer. (Default:0.5)point.alpha:Numeric scalar. Transparency of the point layer. (Default:0.65)line.alpha:Numeric scalar. Transparency of the line layer. (Default:0.5)point.shape:Numeric scalar. Shape of points. (Default:21)point.size:Numeric scalar. Size of points. (Default:2)point.colour:Character scalar. Colour of points. (Default:"grey70")linetype:Numeric scalar. Type of lines. (Default:1)linewidth:Numeric scalar. Width of lines. (Default:1)line.colour:Character scalar. Colour of lines. (Default:"grey70")box.width:Numeric scalar. Width of boxes. (Default:0.75)bar.width:Numeric scalar. Width of proportion bars. By default, it is calculated based so that the width matches with the width of boxes.
- assay.type
NULLorcharacter scalar. Specifies the abundace table to plot. (Default:NULL)- row.var
NULLorcharacter scalar. Specifies a variable fromrowData(x)to visualize. (Default:NULL)- col.var
NULLorcharacter scalarSpecifies a variable fromcolData(x)to visualize. (Default:NULL)- x
NULLorcharacter vector. Specifies a variable fromcolData(x)orrowData(x)to visualize in x axis. (Default:NULL)- features
NULLorcharacter vector. Ifassay.typeis specified, this specifies rows to visualize in different facets. IfNULL, whole data is visualized as a whole. (Default:NULL)- group.by
NULLorcharacter vector. Specifies a variable fromcolData(x)orrowData(x)to group observations. (Default:NULL)
Value
A ggplot2 object.
Details
A box plot is standard visualization technique to compare numeric values,
such as abundance, between categorical values, such as sample groups.
plotBoxplot() streamlines creation of box plots, and it offers
multiple options for visualization.
Examples
data("Tito2024QMP")
tse <- Tito2024QMP
tse <- transformAssay(tse, method = "relabundance")
tse <- addAlpha(tse, index = "shannon")
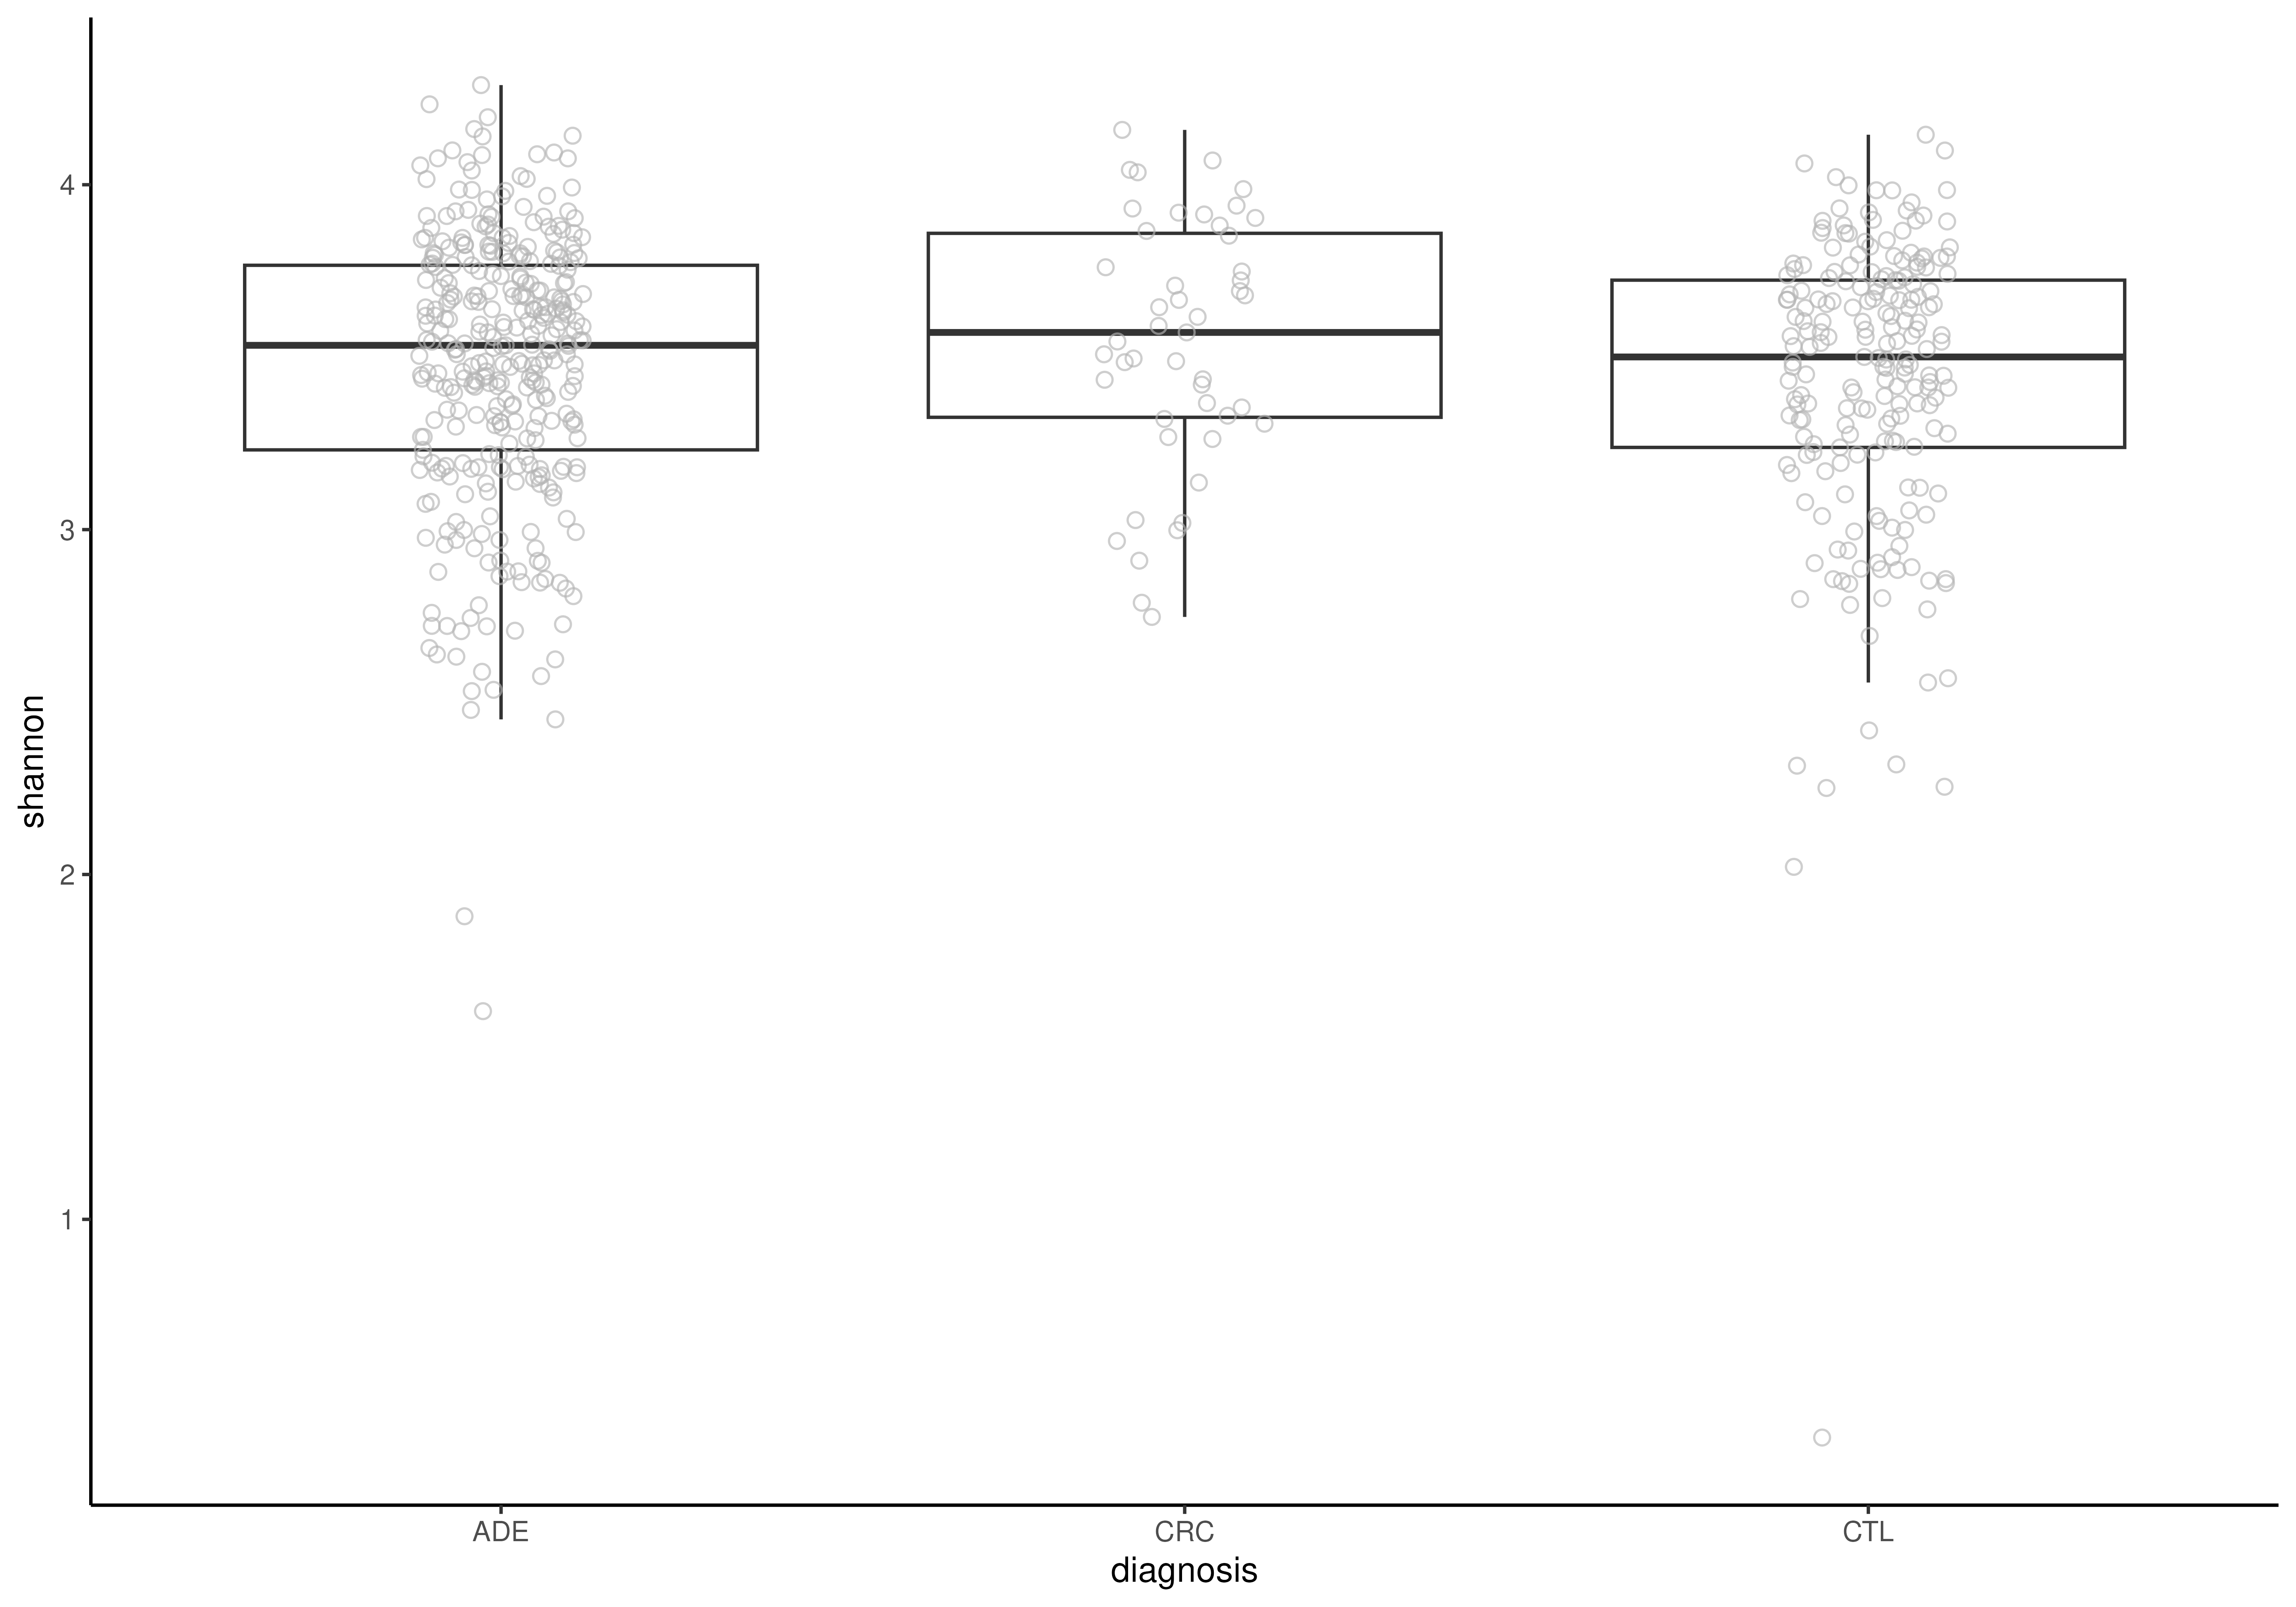
# Visualize alpha diversity
plotBoxplot(tse, col.var = "shannon", x = "diagnosis")
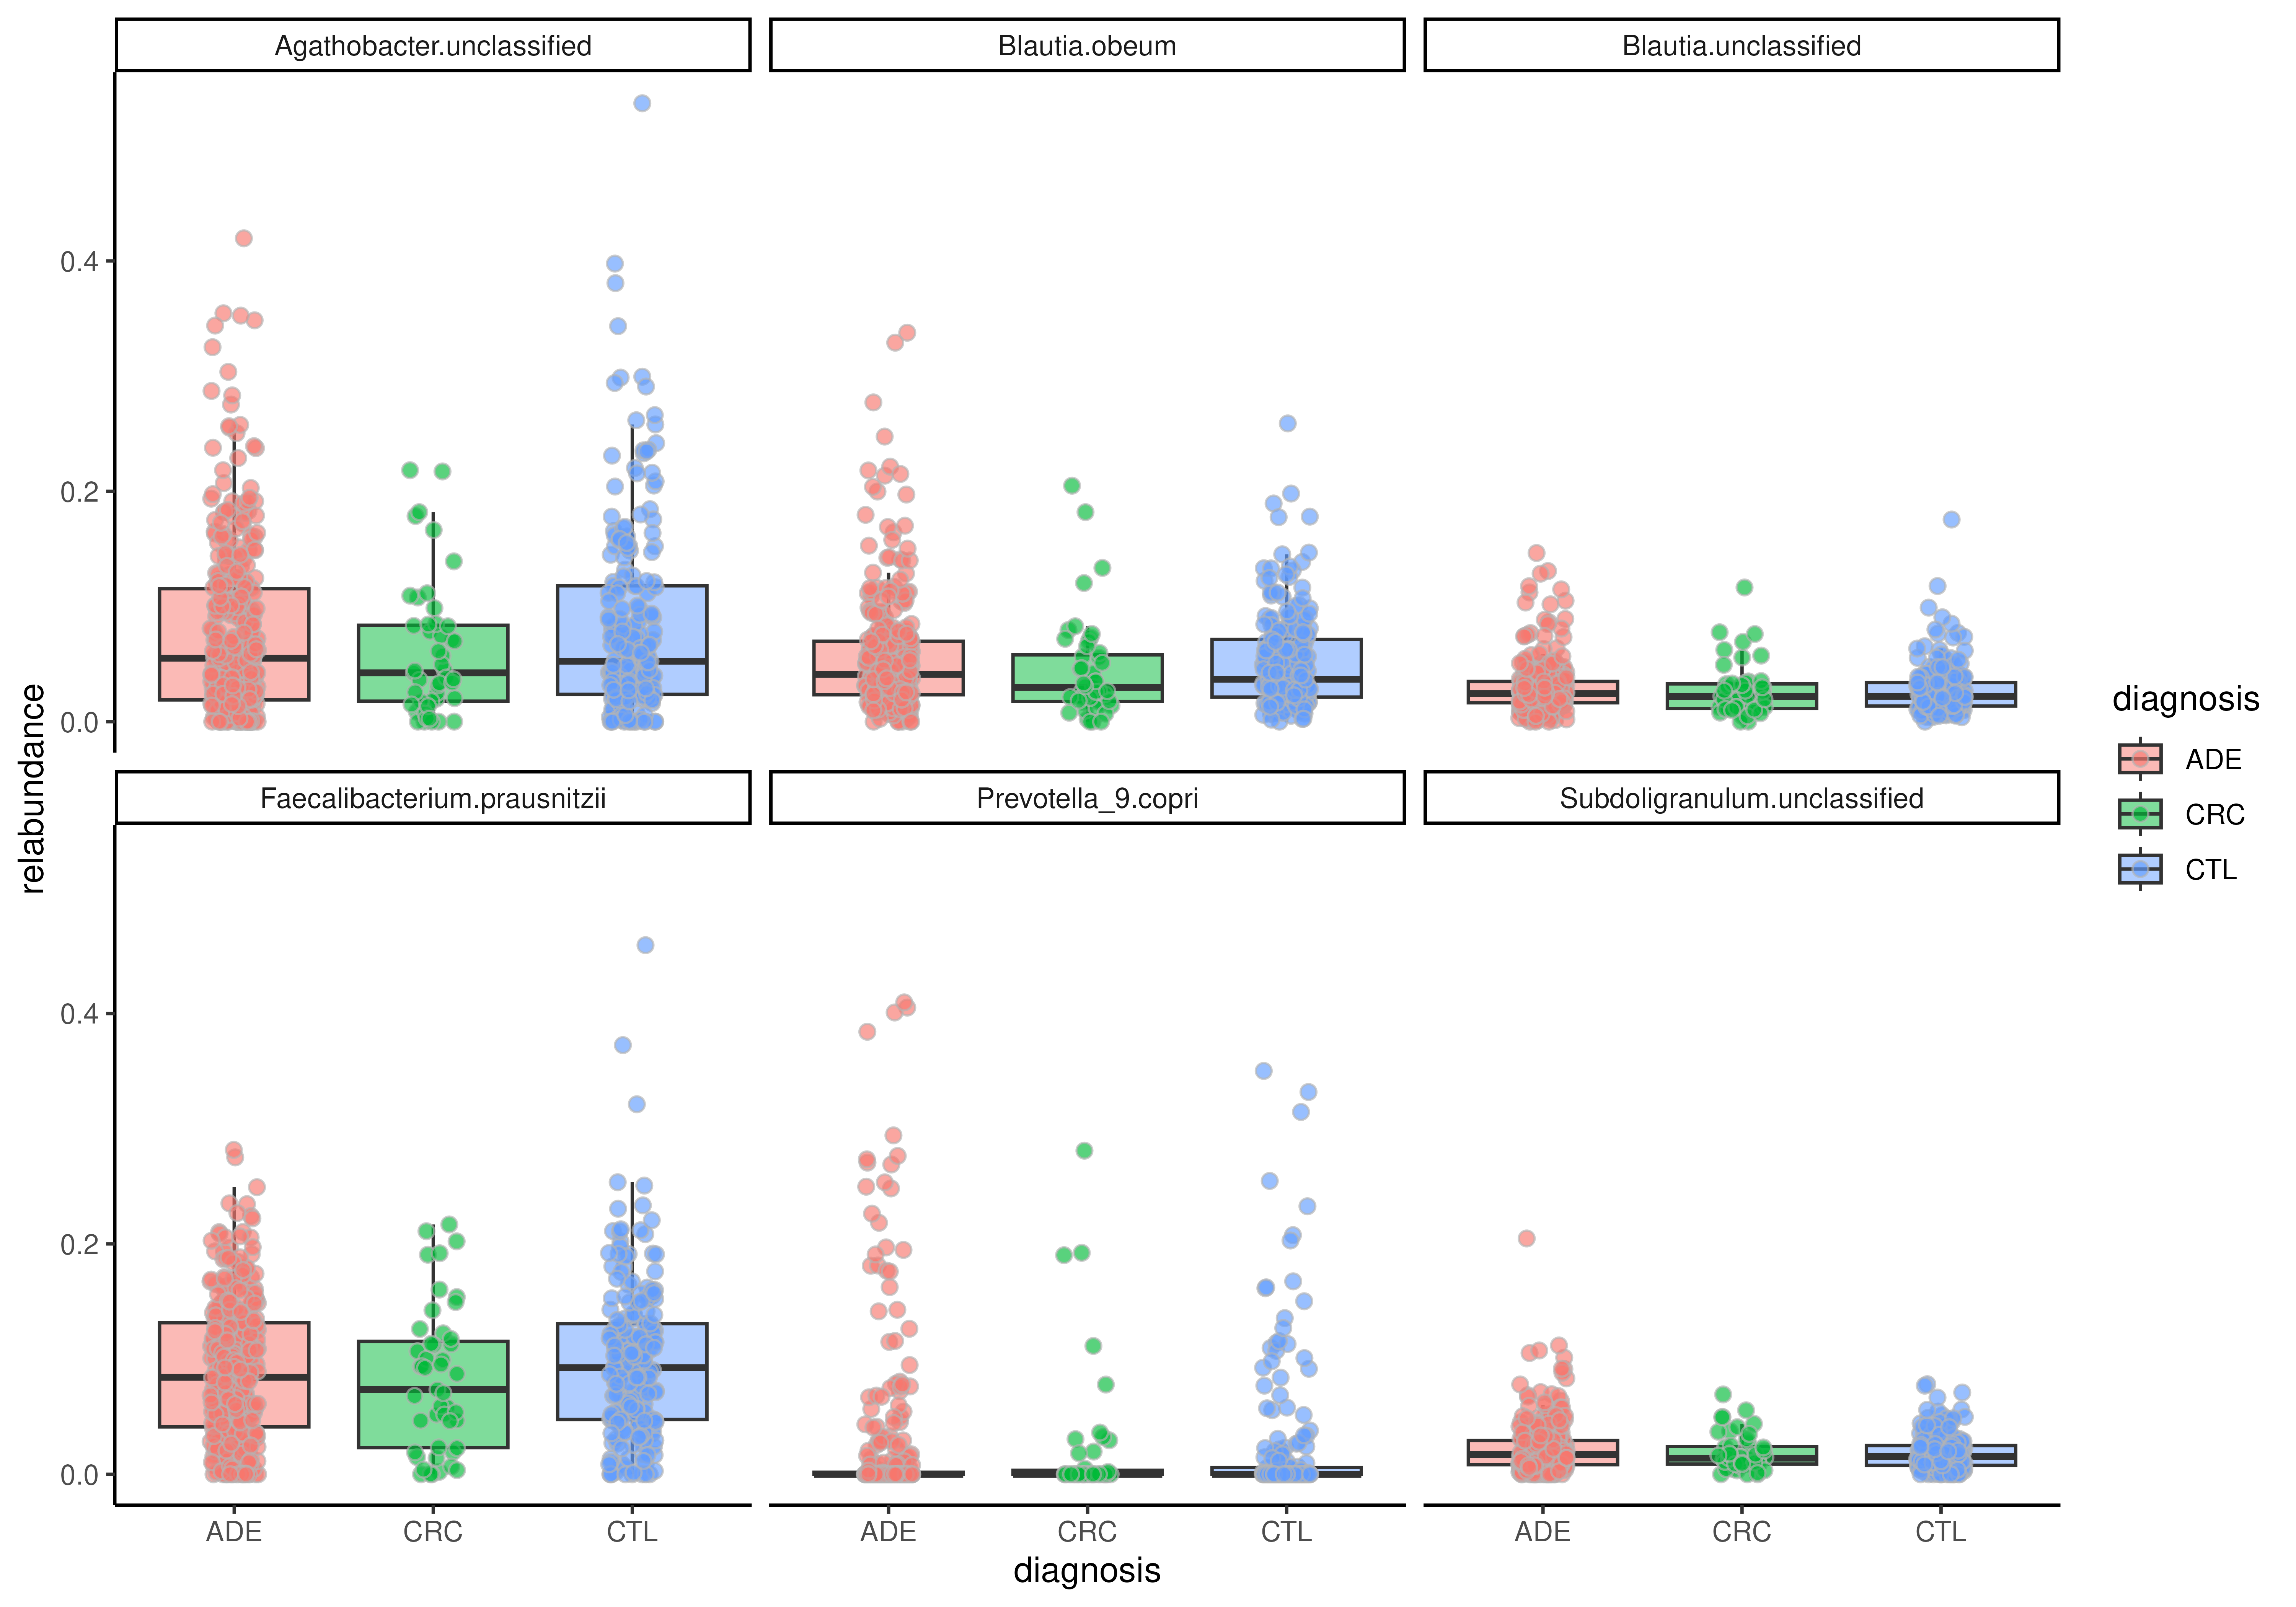
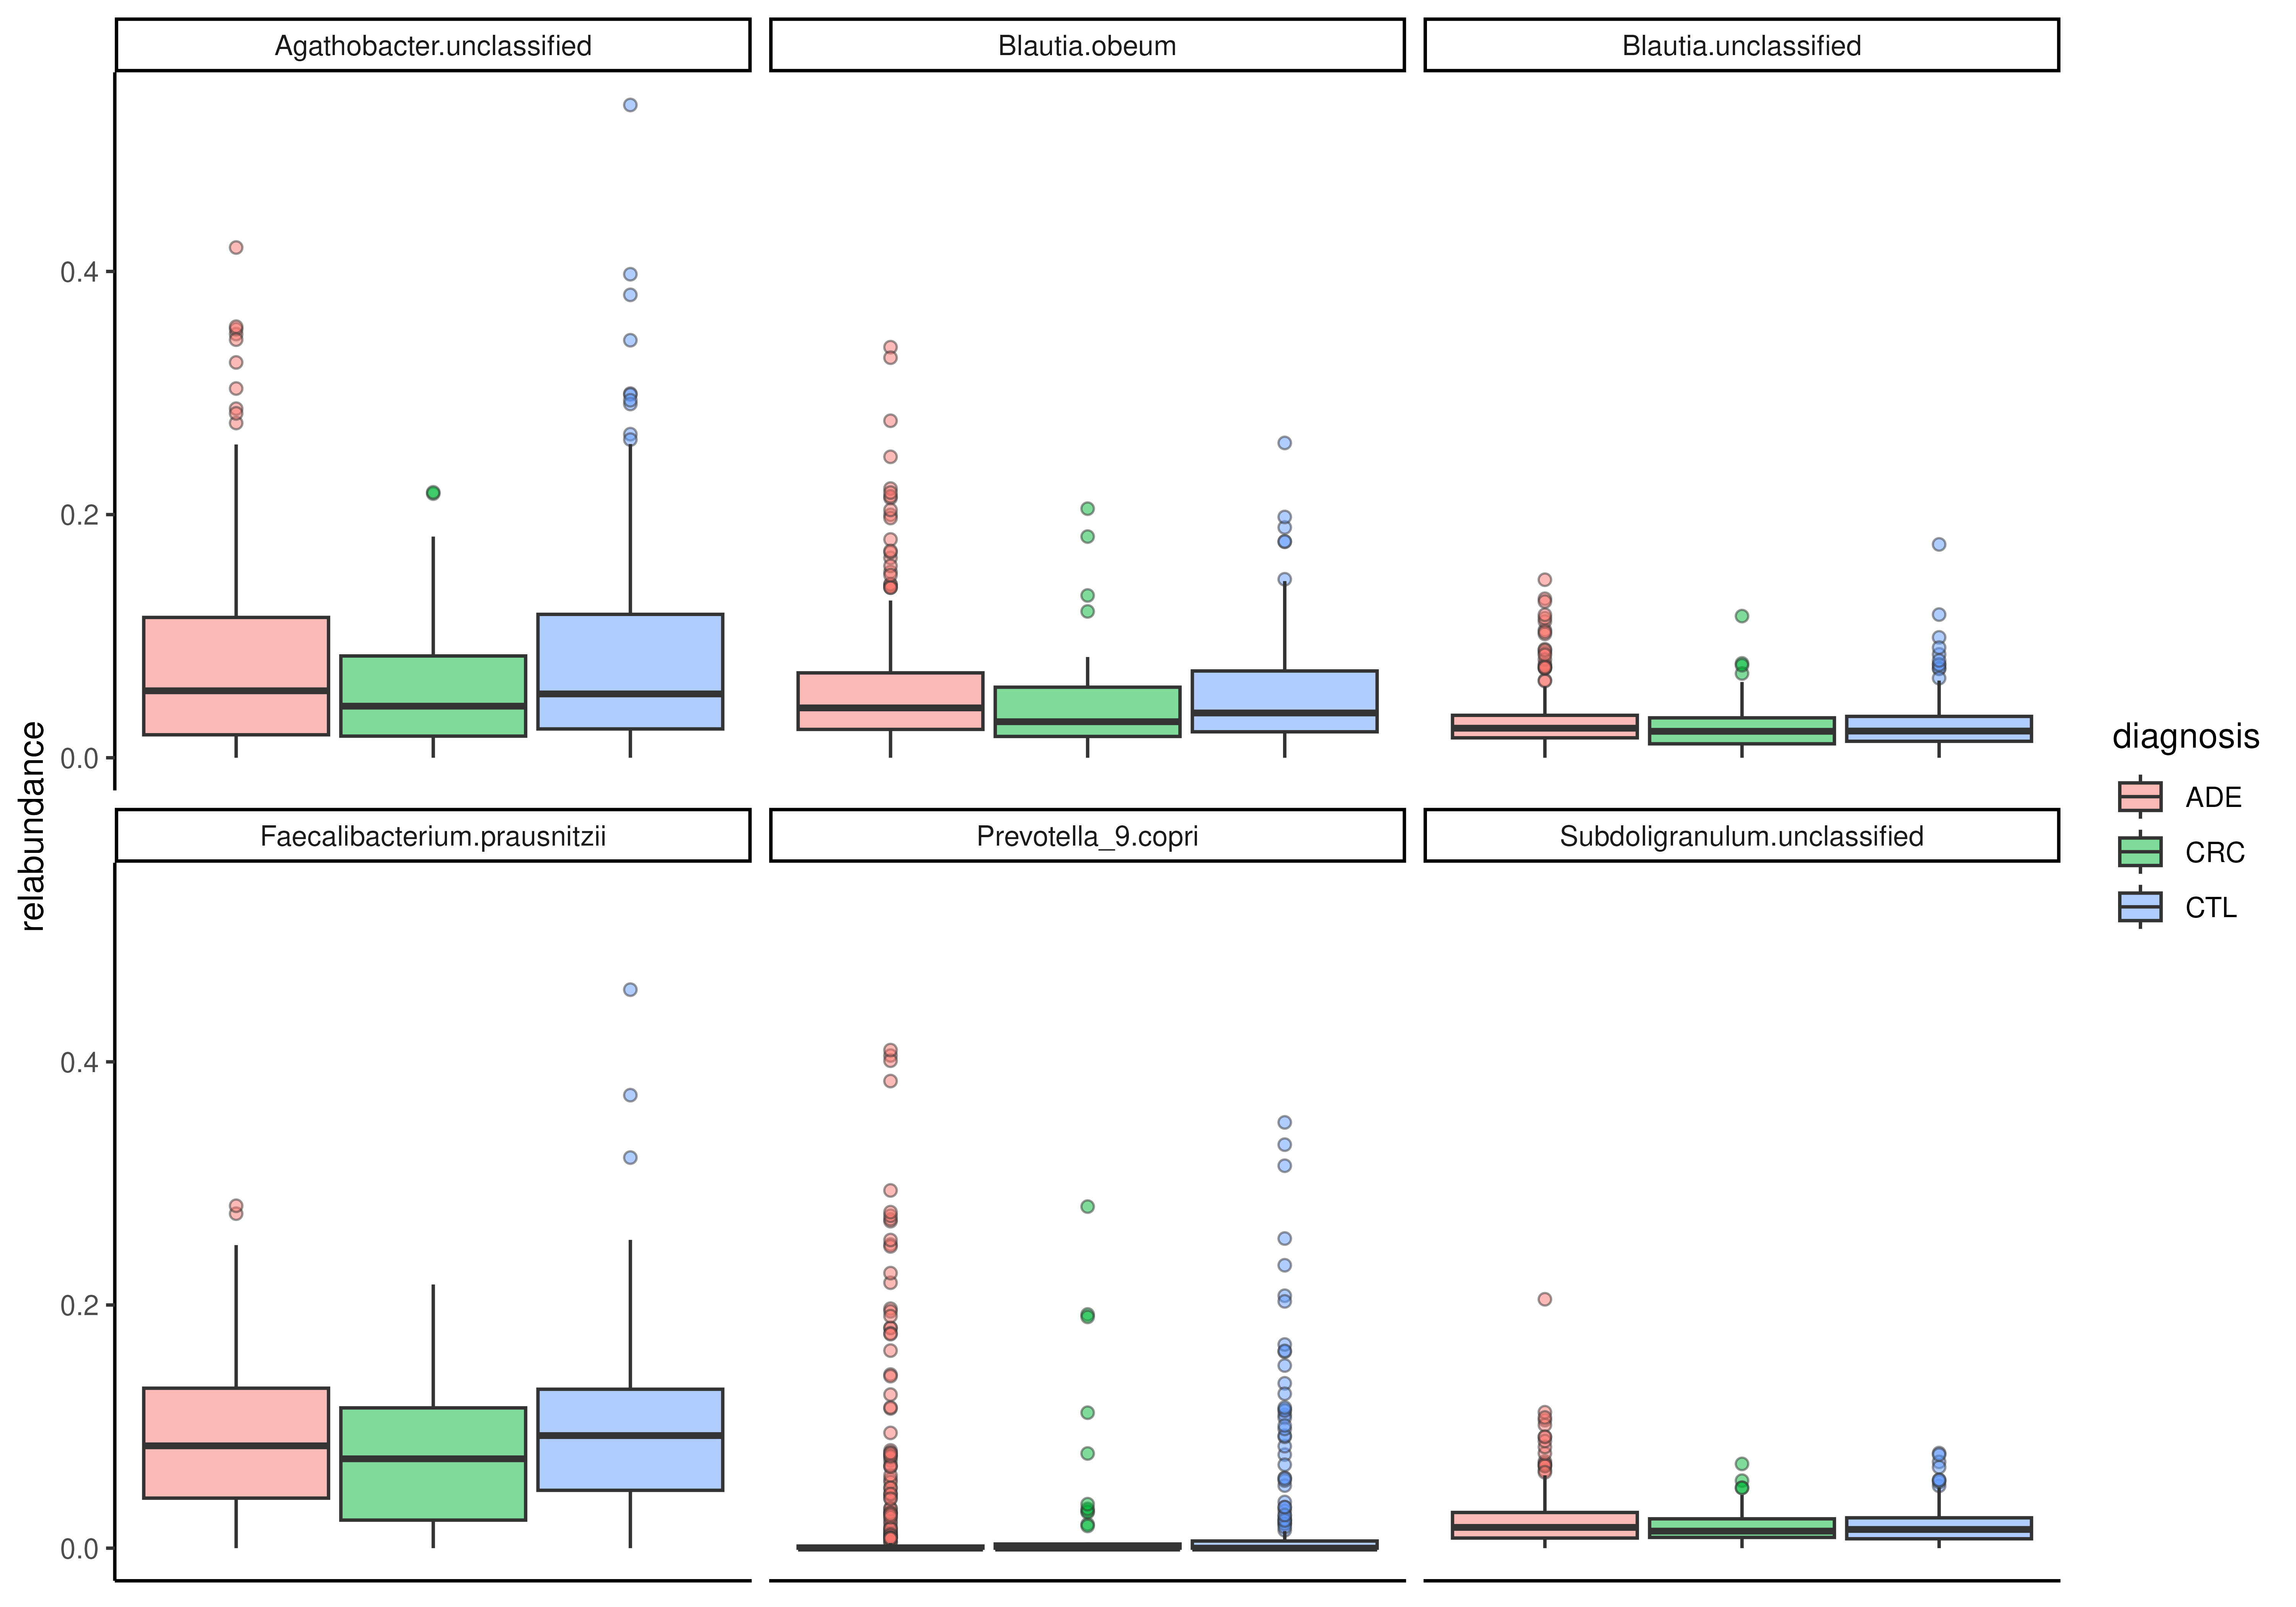
 # Visualize relative abundance of top features
tse <- tse[getTop(tse, 6), ]
plotBoxplot(
tse, assay.type = "relabundance",
x = "diagnosis", fill.by = "diagnosis",
features = rownames(tse), facet.by = "rownames",
ncol = 2
)
# Visualize relative abundance of top features
tse <- tse[getTop(tse, 6), ]
plotBoxplot(
tse, assay.type = "relabundance",
x = "diagnosis", fill.by = "diagnosis",
features = rownames(tse), facet.by = "rownames",
ncol = 2
)
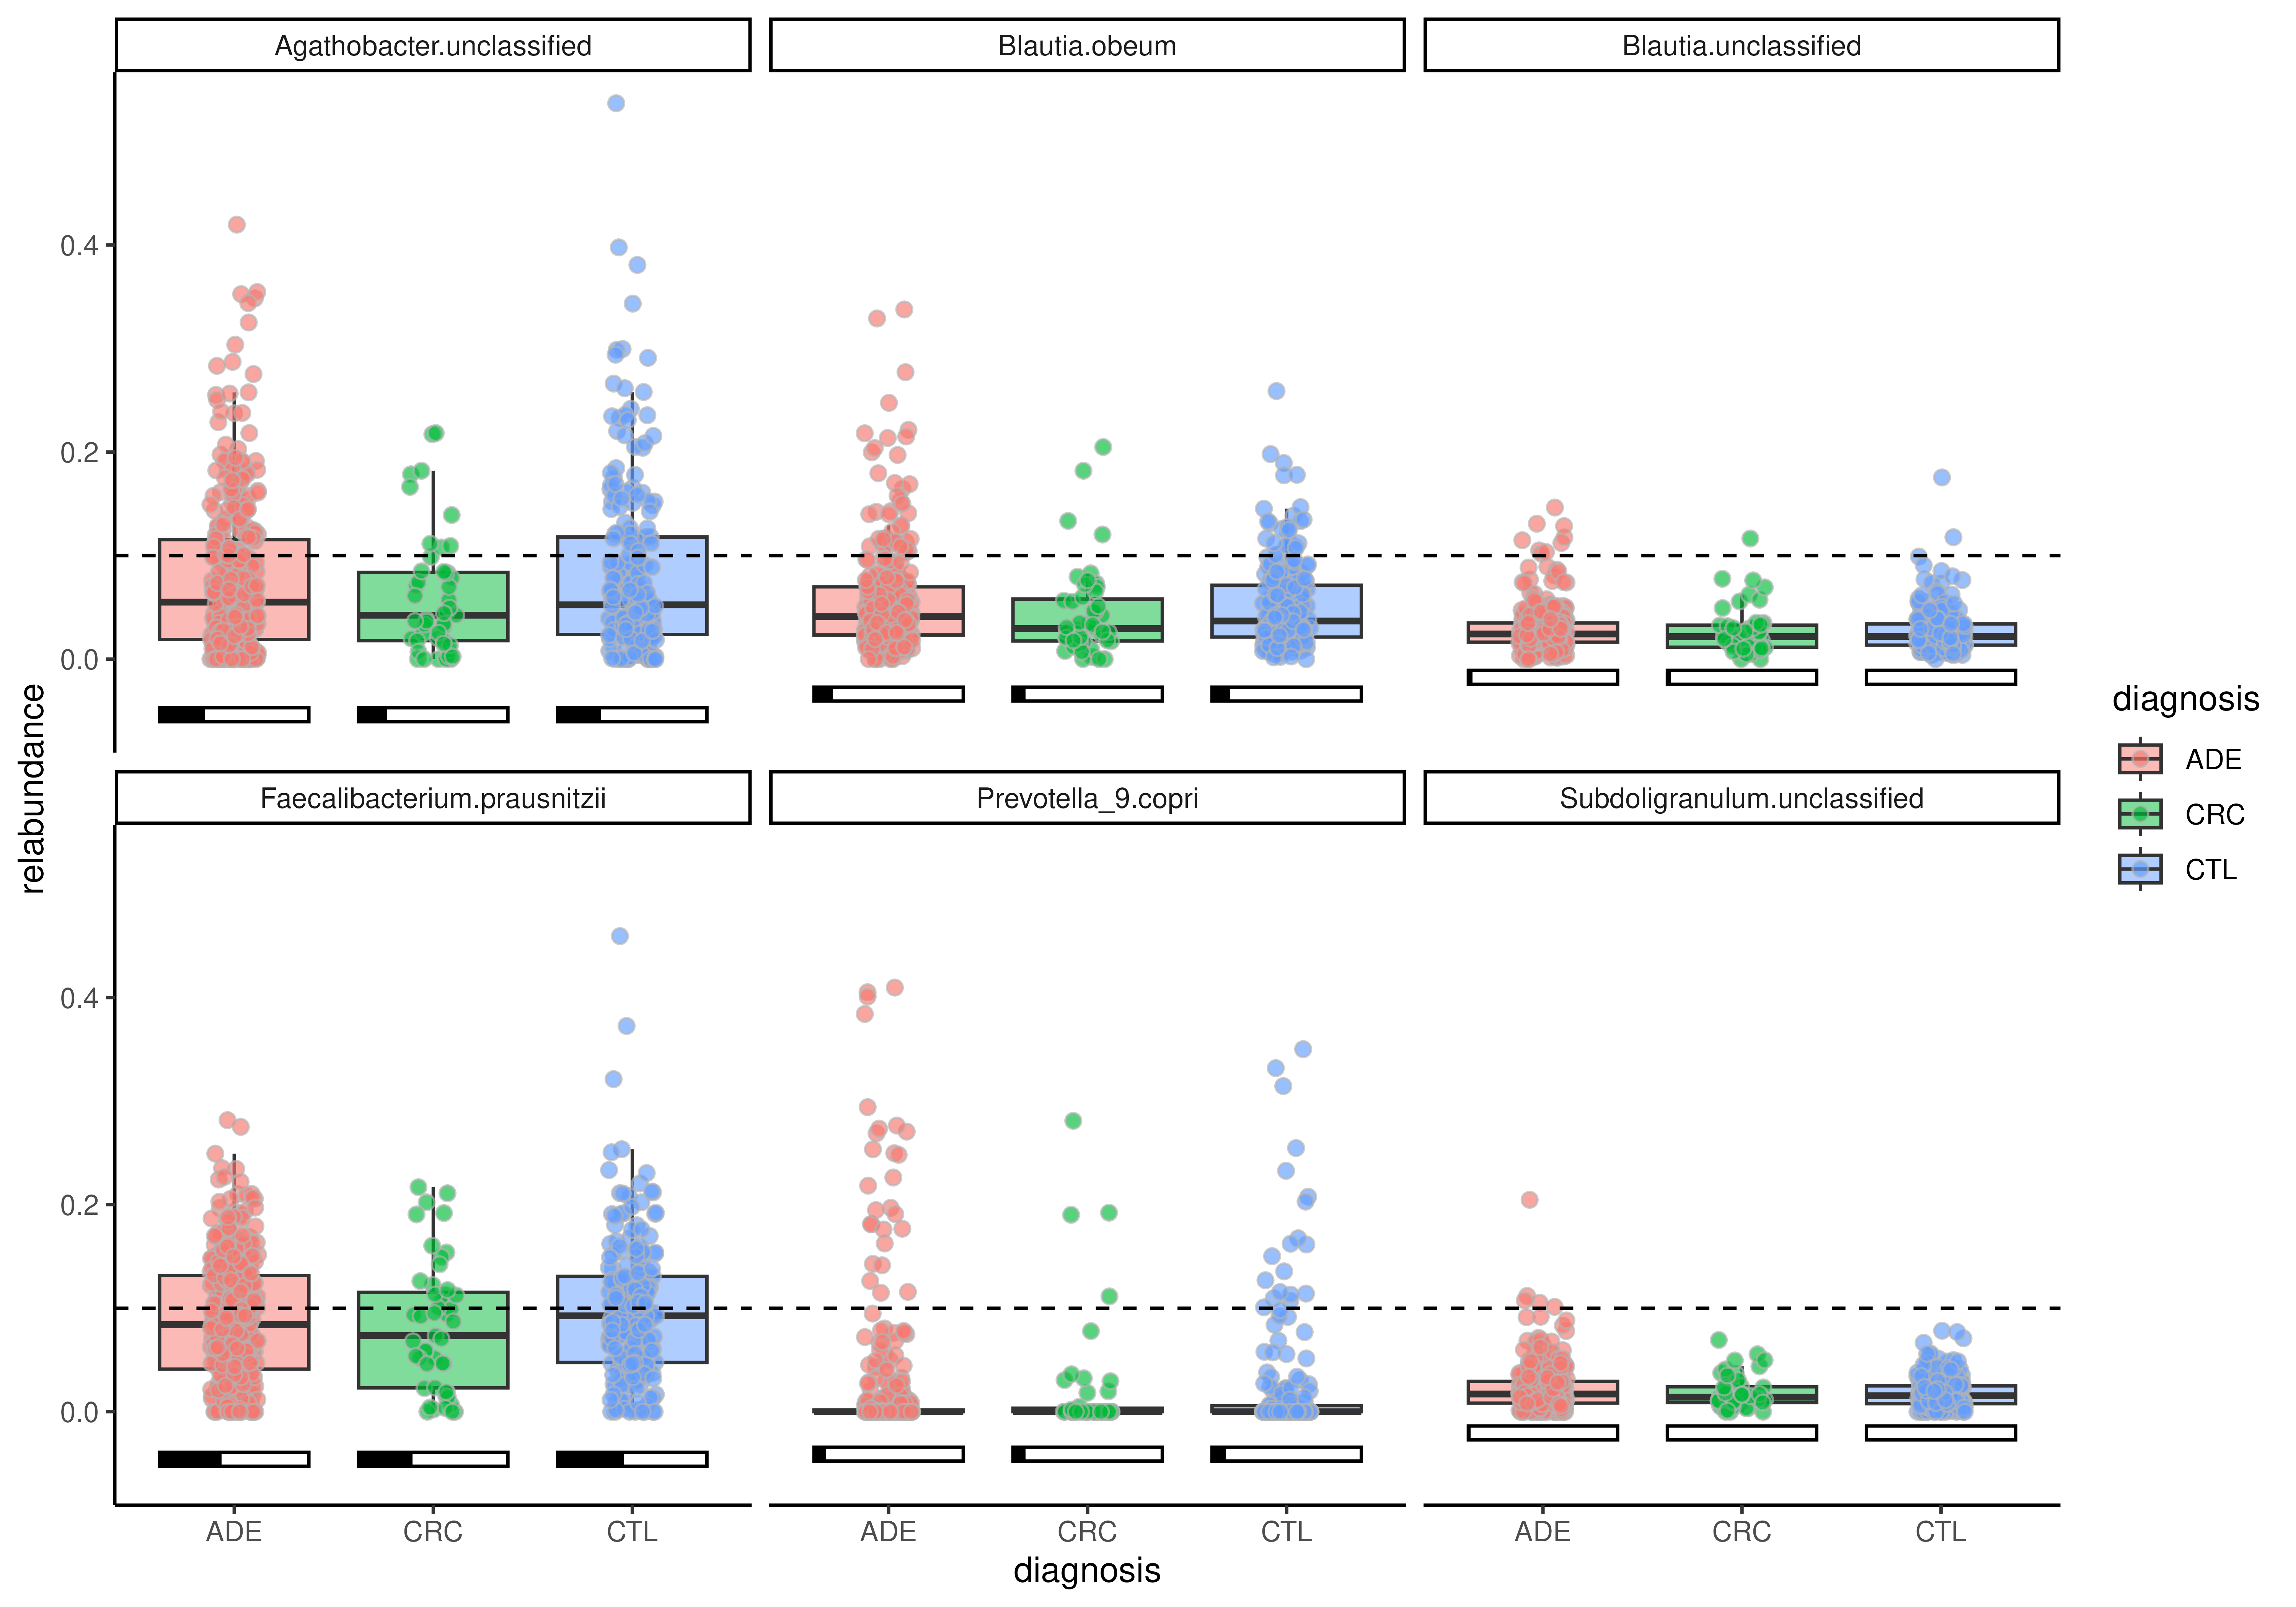
 # Add proportion bar
plotBoxplot(
tse, assay.type = "relabundance",
x = "diagnosis", fill.by = "diagnosis",
features = rownames(tse), facet.by = "rownames",
add.proportion = TRUE, threshold = 0.1
)
# Add proportion bar
plotBoxplot(
tse, assay.type = "relabundance",
x = "diagnosis", fill.by = "diagnosis",
features = rownames(tse), facet.by = "rownames",
add.proportion = TRUE, threshold = 0.1
)
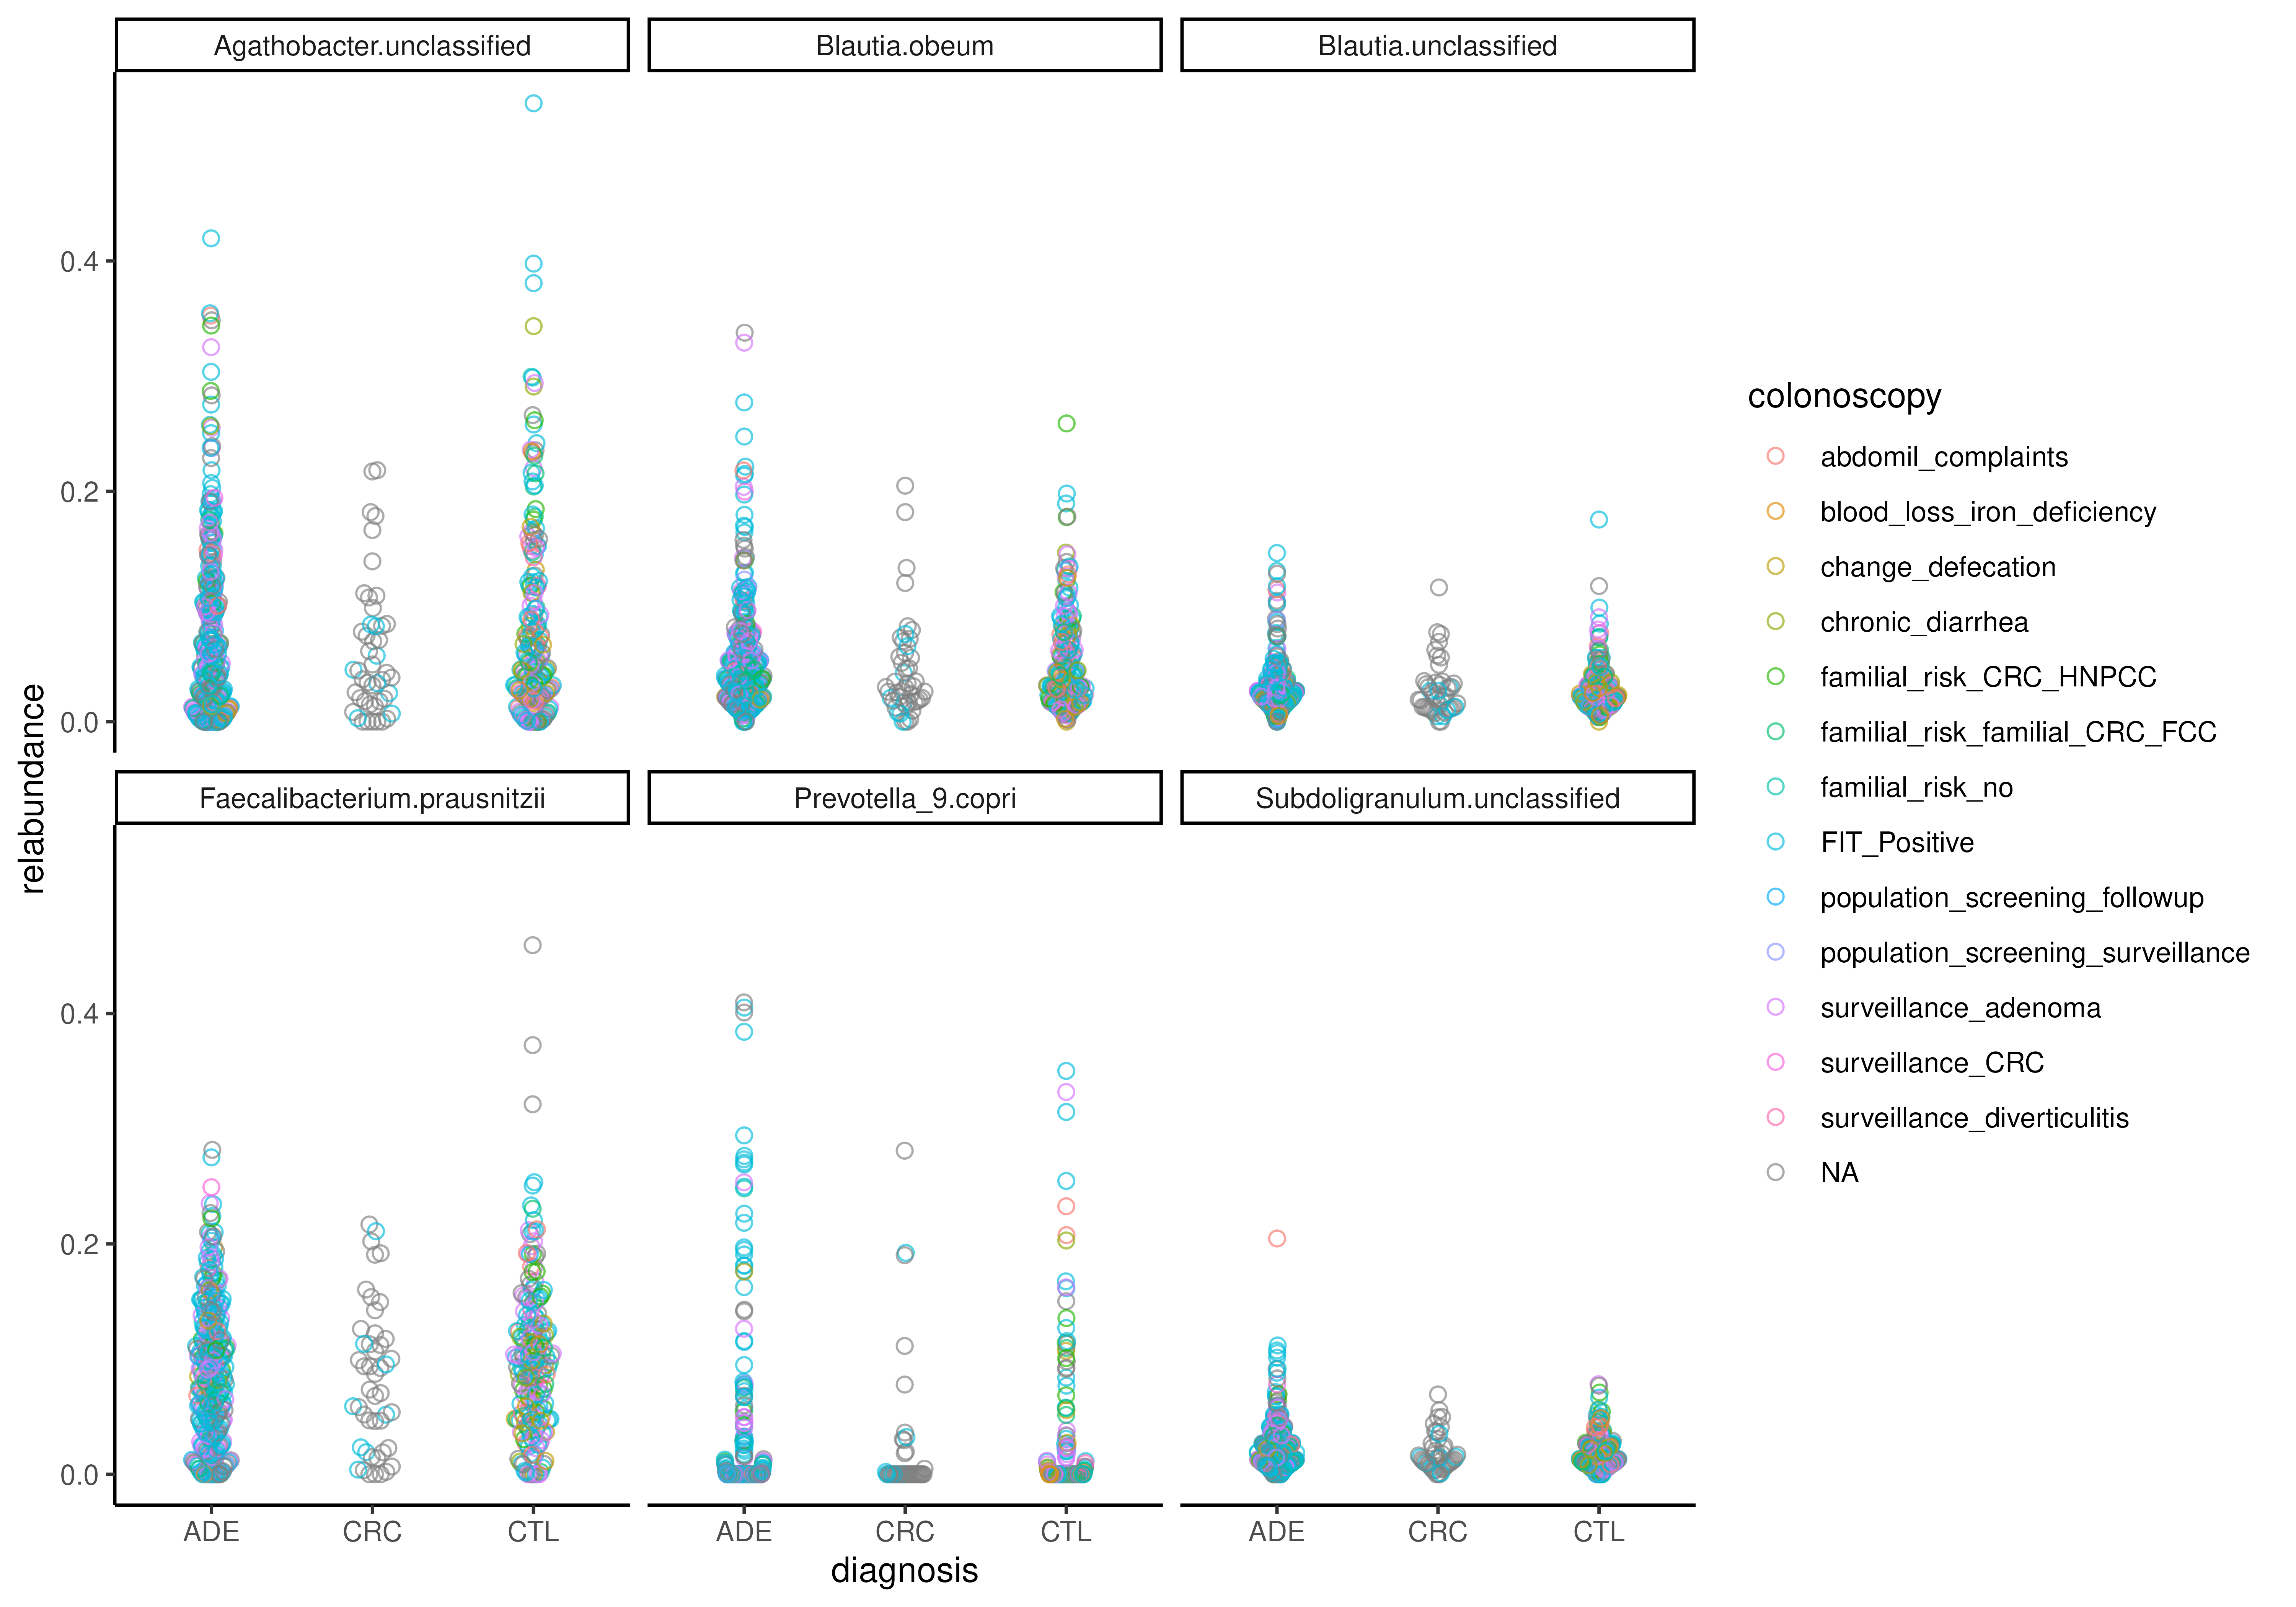
 # Visualize only with beeswarm
plotBoxplot(
tse, assay.type = "relabundance",
x = "diagnosis", group.by = "diagnosis",
colour.by = "colonoscopy",
features = rownames(tse), facet.by = "rownames",
point.offset = "swarm", add.box = FALSE
)
# Visualize only with beeswarm
plotBoxplot(
tse, assay.type = "relabundance",
x = "diagnosis", group.by = "diagnosis",
colour.by = "colonoscopy",
features = rownames(tse), facet.by = "rownames",
point.offset = "swarm", add.box = FALSE
)
 # Do not add points
plotBoxplot(
tse, assay.type = "relabundance",
fill.by = "diagnosis",
features = rownames(tse), facet.by = "rownames",
add.points = FALSE
)
# Do not add points
plotBoxplot(
tse, assay.type = "relabundance",
fill.by = "diagnosis",
features = rownames(tse), facet.by = "rownames",
add.points = FALSE
)
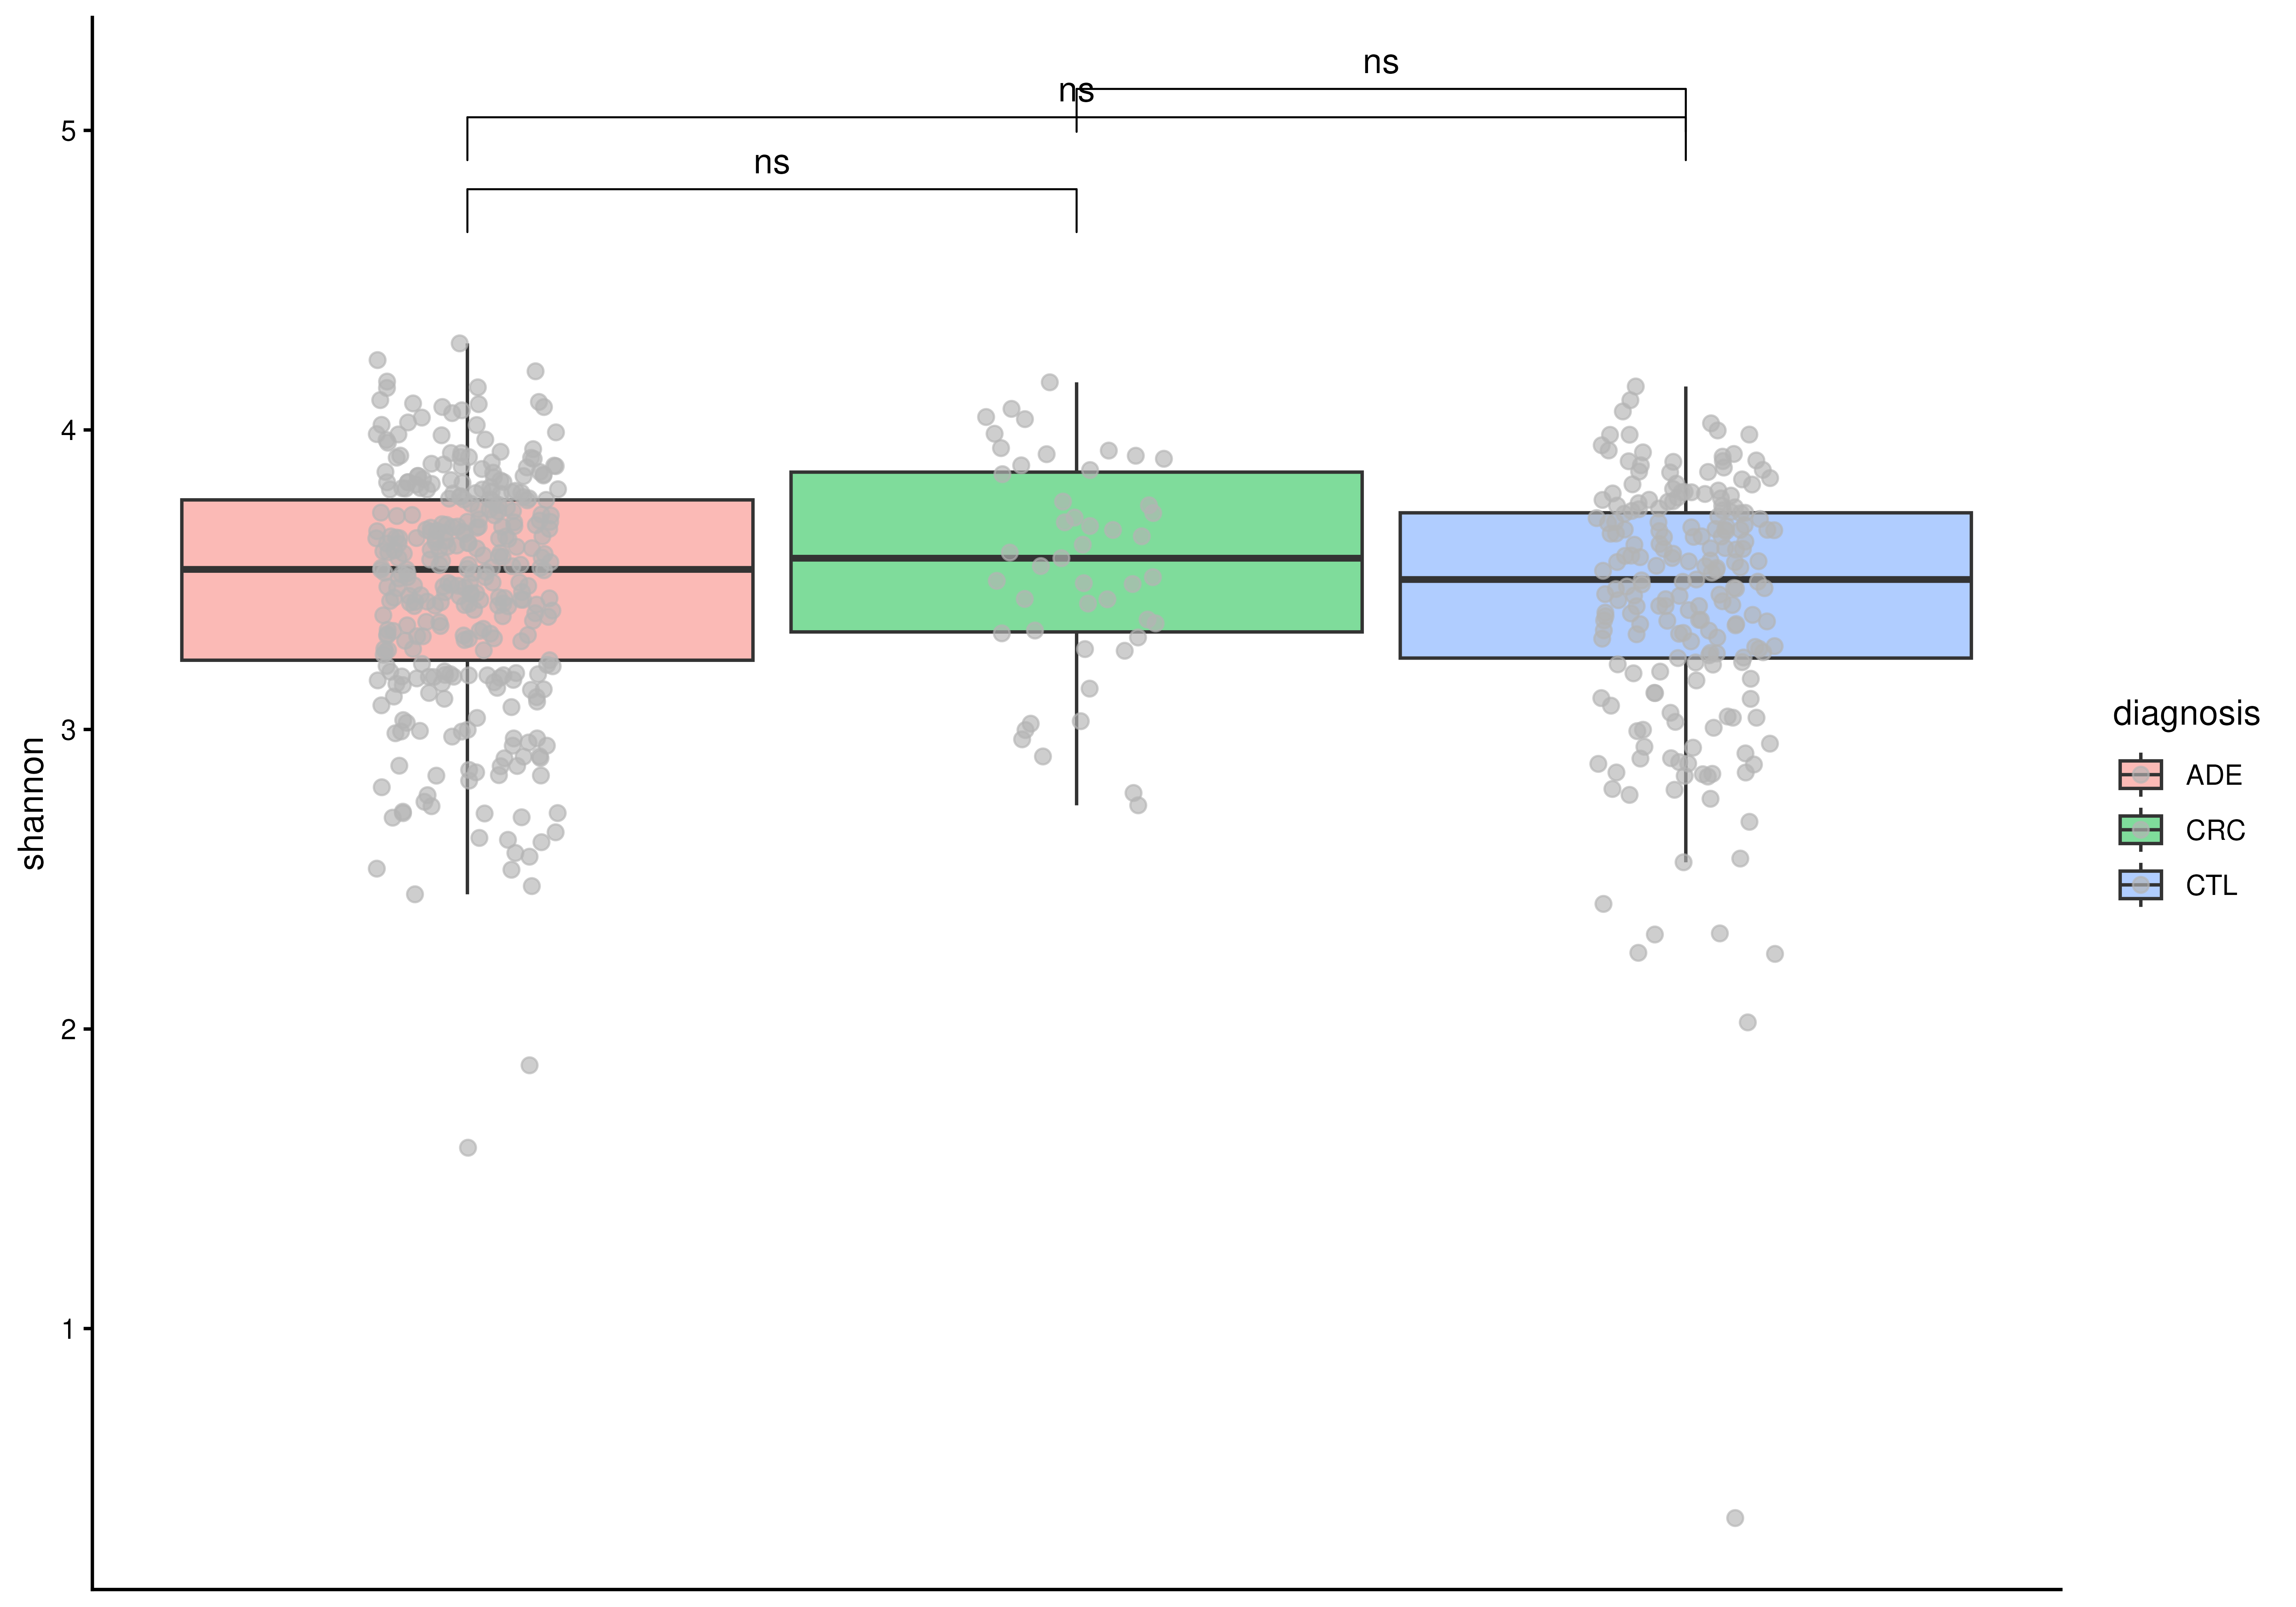
 # Calculate statistical significance with Wilcoxon test
plotBoxplot(
tse,
col.var = "shannon",
fill.by = "diagnosis",
add.significance = TRUE
)
# Calculate statistical significance with Wilcoxon test
plotBoxplot(
tse,
col.var = "shannon",
fill.by = "diagnosis",
add.significance = TRUE
)
 if (FALSE) { # \dontrun{
# Add pre-calculated p-values
# Calculate p-values
df <- meltSE(tse, add.col = TRUE)
pvals <- df |>
rstatix::t_test(shannon ~ diagnosis) |>
ungroup() |>
as.data.frame()
# Add them with p.value argument
plotBoxplot(
tse,
x = "diagnosis",
col.var = "shannon",
p.value = pvals
)
} # }
if (FALSE) { # \dontrun{
library(microbiomeDataSets)
mae <- microbiomeDataSets::peerj32()
tse <- getWithColData(mae, 1)
tse[["time_point"]] <- as.character(tse[["time"]])
# Create a plot showing chance between time points in abundance of
# Akkermansia
plotBoxplot(
tse, x = "time_point", assay.type = "counts", fill.by = "group",
features = "Akkermansia", pair.by = "subject",
add.chance = TRUE, scales = "free"
)
} # }
if (FALSE) { # \dontrun{
# Add pre-calculated p-values
# Calculate p-values
df <- meltSE(tse, add.col = TRUE)
pvals <- df |>
rstatix::t_test(shannon ~ diagnosis) |>
ungroup() |>
as.data.frame()
# Add them with p.value argument
plotBoxplot(
tse,
x = "diagnosis",
col.var = "shannon",
p.value = pvals
)
} # }
if (FALSE) { # \dontrun{
library(microbiomeDataSets)
mae <- microbiomeDataSets::peerj32()
tse <- getWithColData(mae, 1)
tse[["time_point"]] <- as.character(tse[["time"]])
# Create a plot showing chance between time points in abundance of
# Akkermansia
plotBoxplot(
tse, x = "time_point", assay.type = "counts", fill.by = "group",
features = "Akkermansia", pair.by = "subject",
add.chance = TRUE, scales = "free"
)
} # }