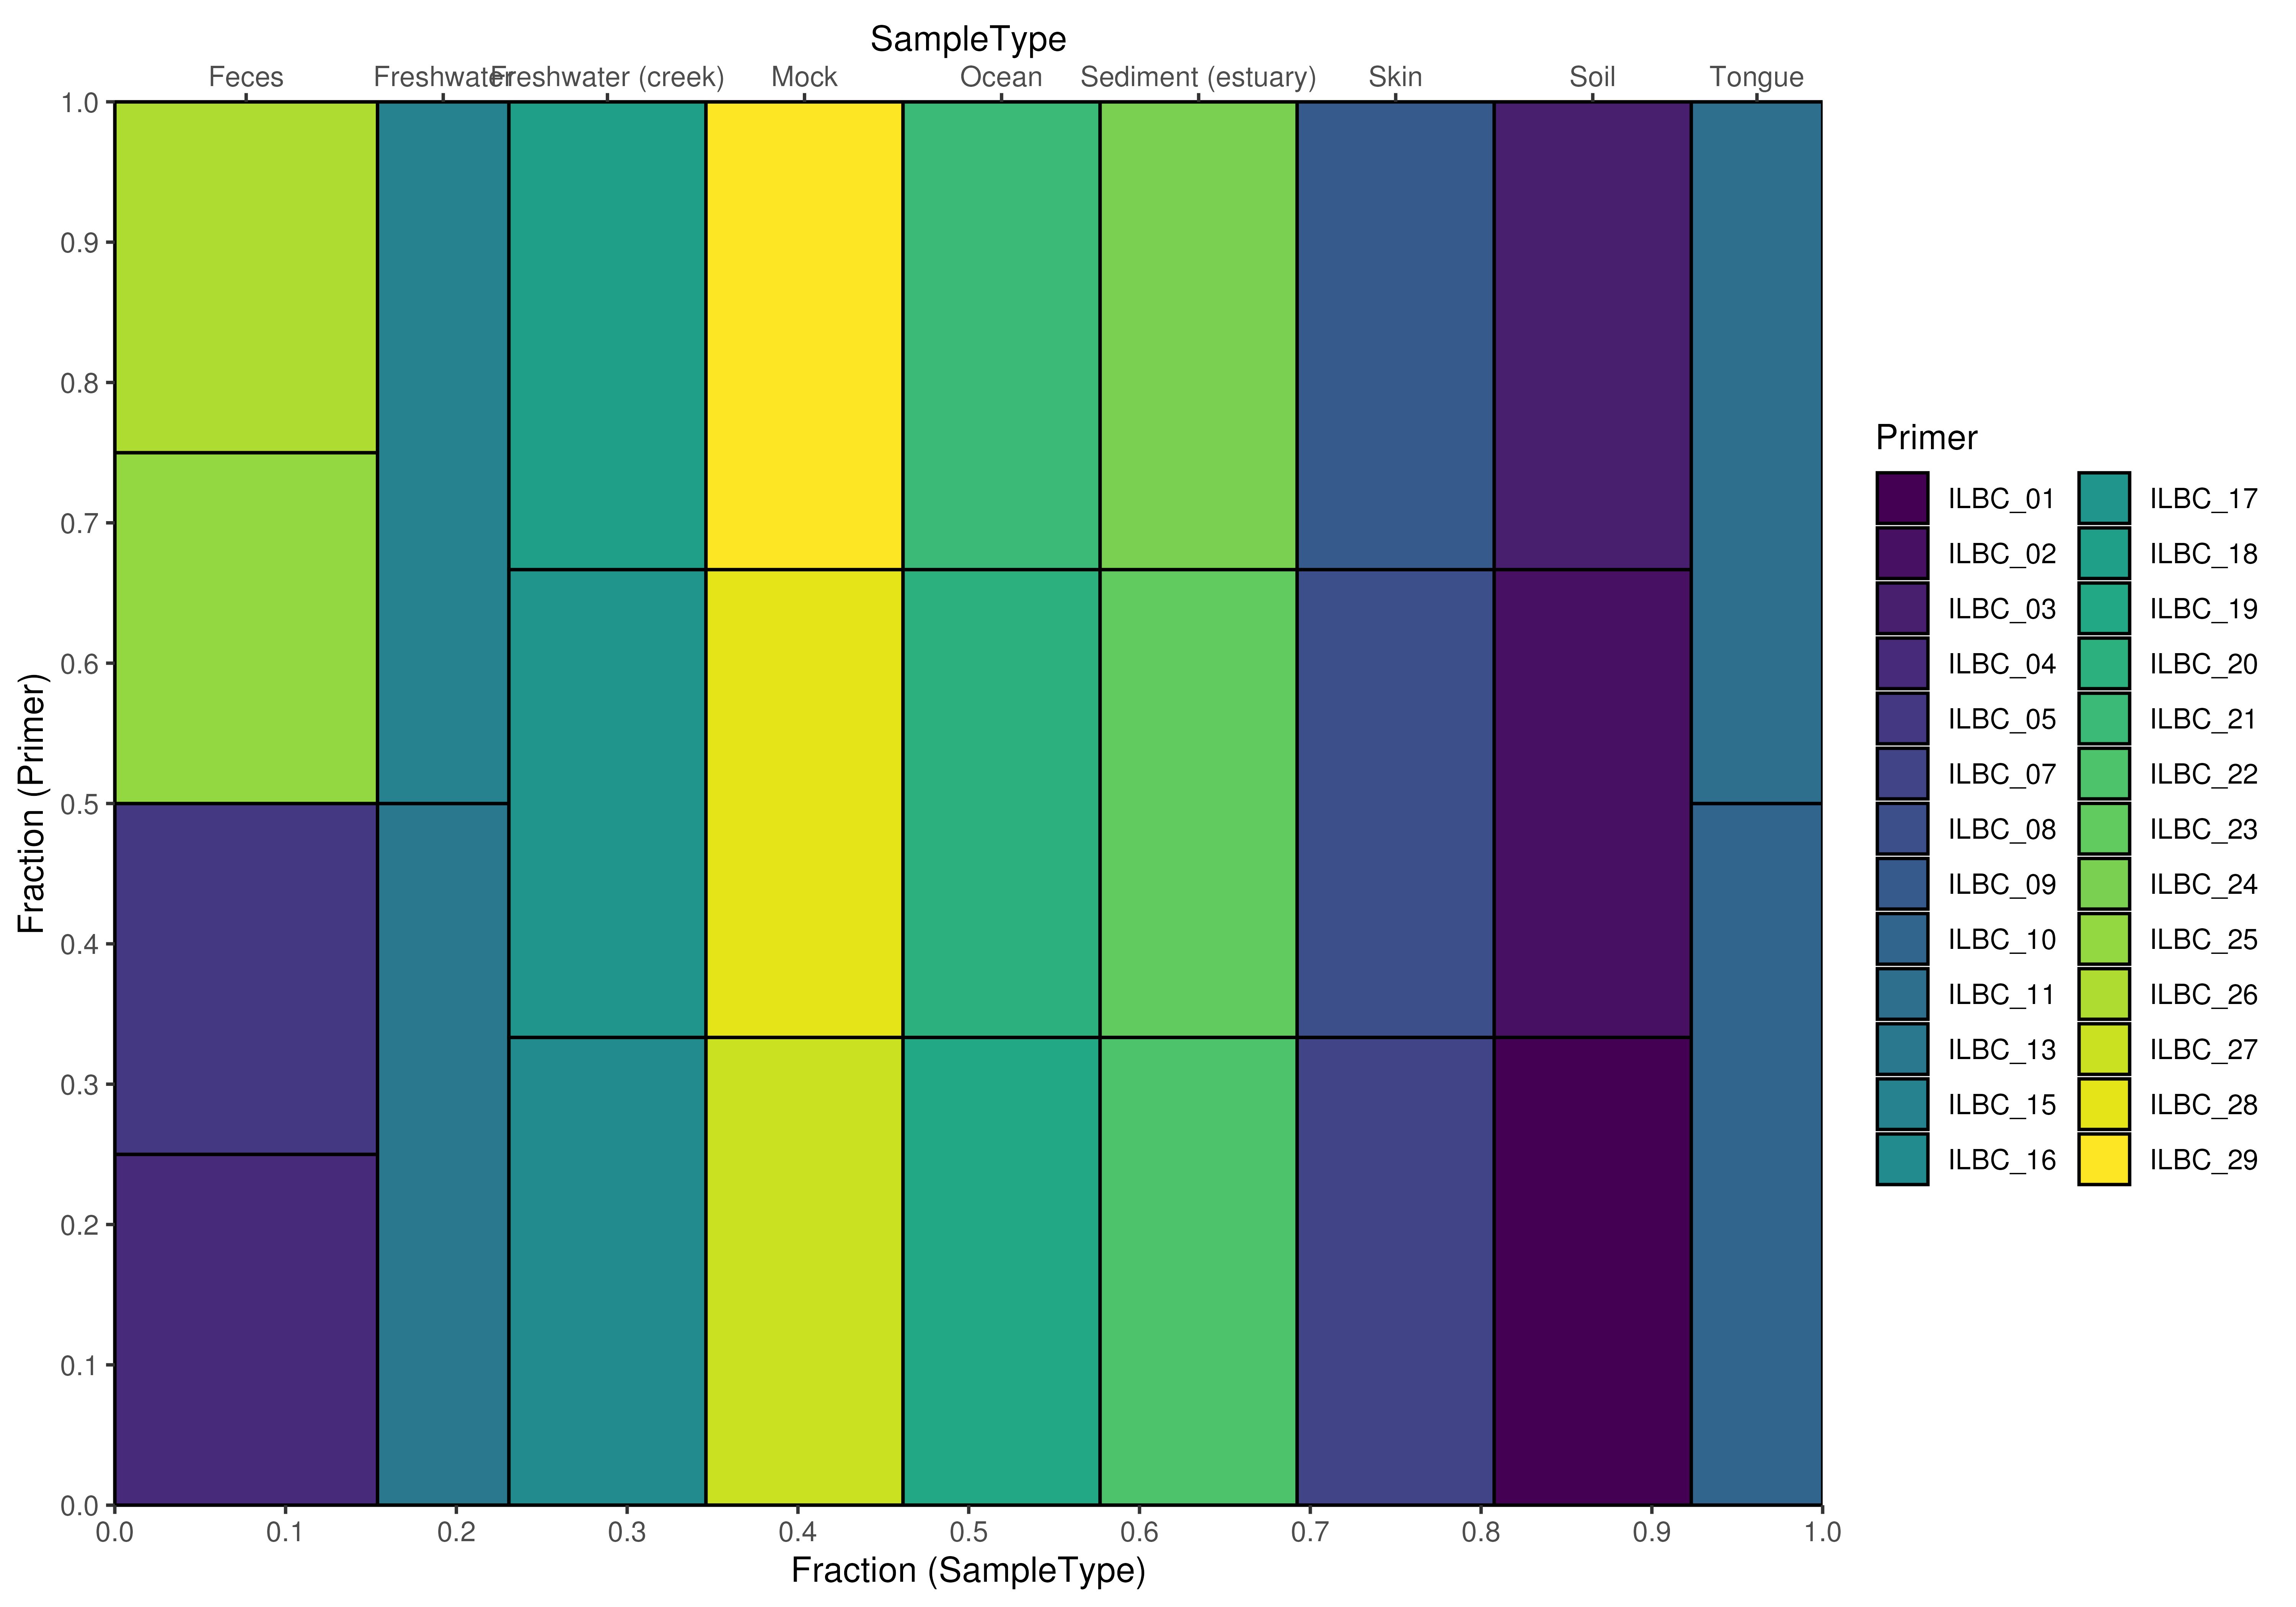
Relative relations of two grouping can be visualized by plotting tiles with
relative sizes. plotColTile and plotRowTile can be used for
this.
plotColTile(object, x, y, ...)

plotRowTile(object, x, y, ...)

# S4 method for class 'SummarizedExperiment'
plotColTile(object, x, y, ...)

# S4 method for class 'SummarizedExperiment'
plotRowTile(object, x, y, ...)
Arguments
- object
a
SummarizedExperimentobject.- x
Character scalar. Specifies the column-level metadata field to show on the x-axis. Alternatively, an AsIs vector or data.frame, see?retrieveFeatureInfoor?retrieveCellInfo. Must result in a returnedcharacterorfactorvector.- y
Character scalar. Specifies the column-level metadata to show on the y-axis. Alternatively, an AsIs vector or data.frame, see?retrieveFeatureInfoor?retrieveCellInfo. Must result in a returnedcharacterorfactorvector.- ...
additional arguments for plotting. See
mia-plot-argsfor more details i.e. callhelp("mia-plot-args")
Value
A ggplot2 object or plotly object, if more than one
prevalences was defined.
Examples
data(GlobalPatterns)
se <- GlobalPatterns
plotColTile(se,"SampleType","Primer")