Visualize a dissimilarity matrix as a heatmap
Source:R/AllGenerics.R, R/plotHeatmap.R
plotDissimilarity.RdPlots a sample dissimilarity matrix, stored in metadata(x), as a
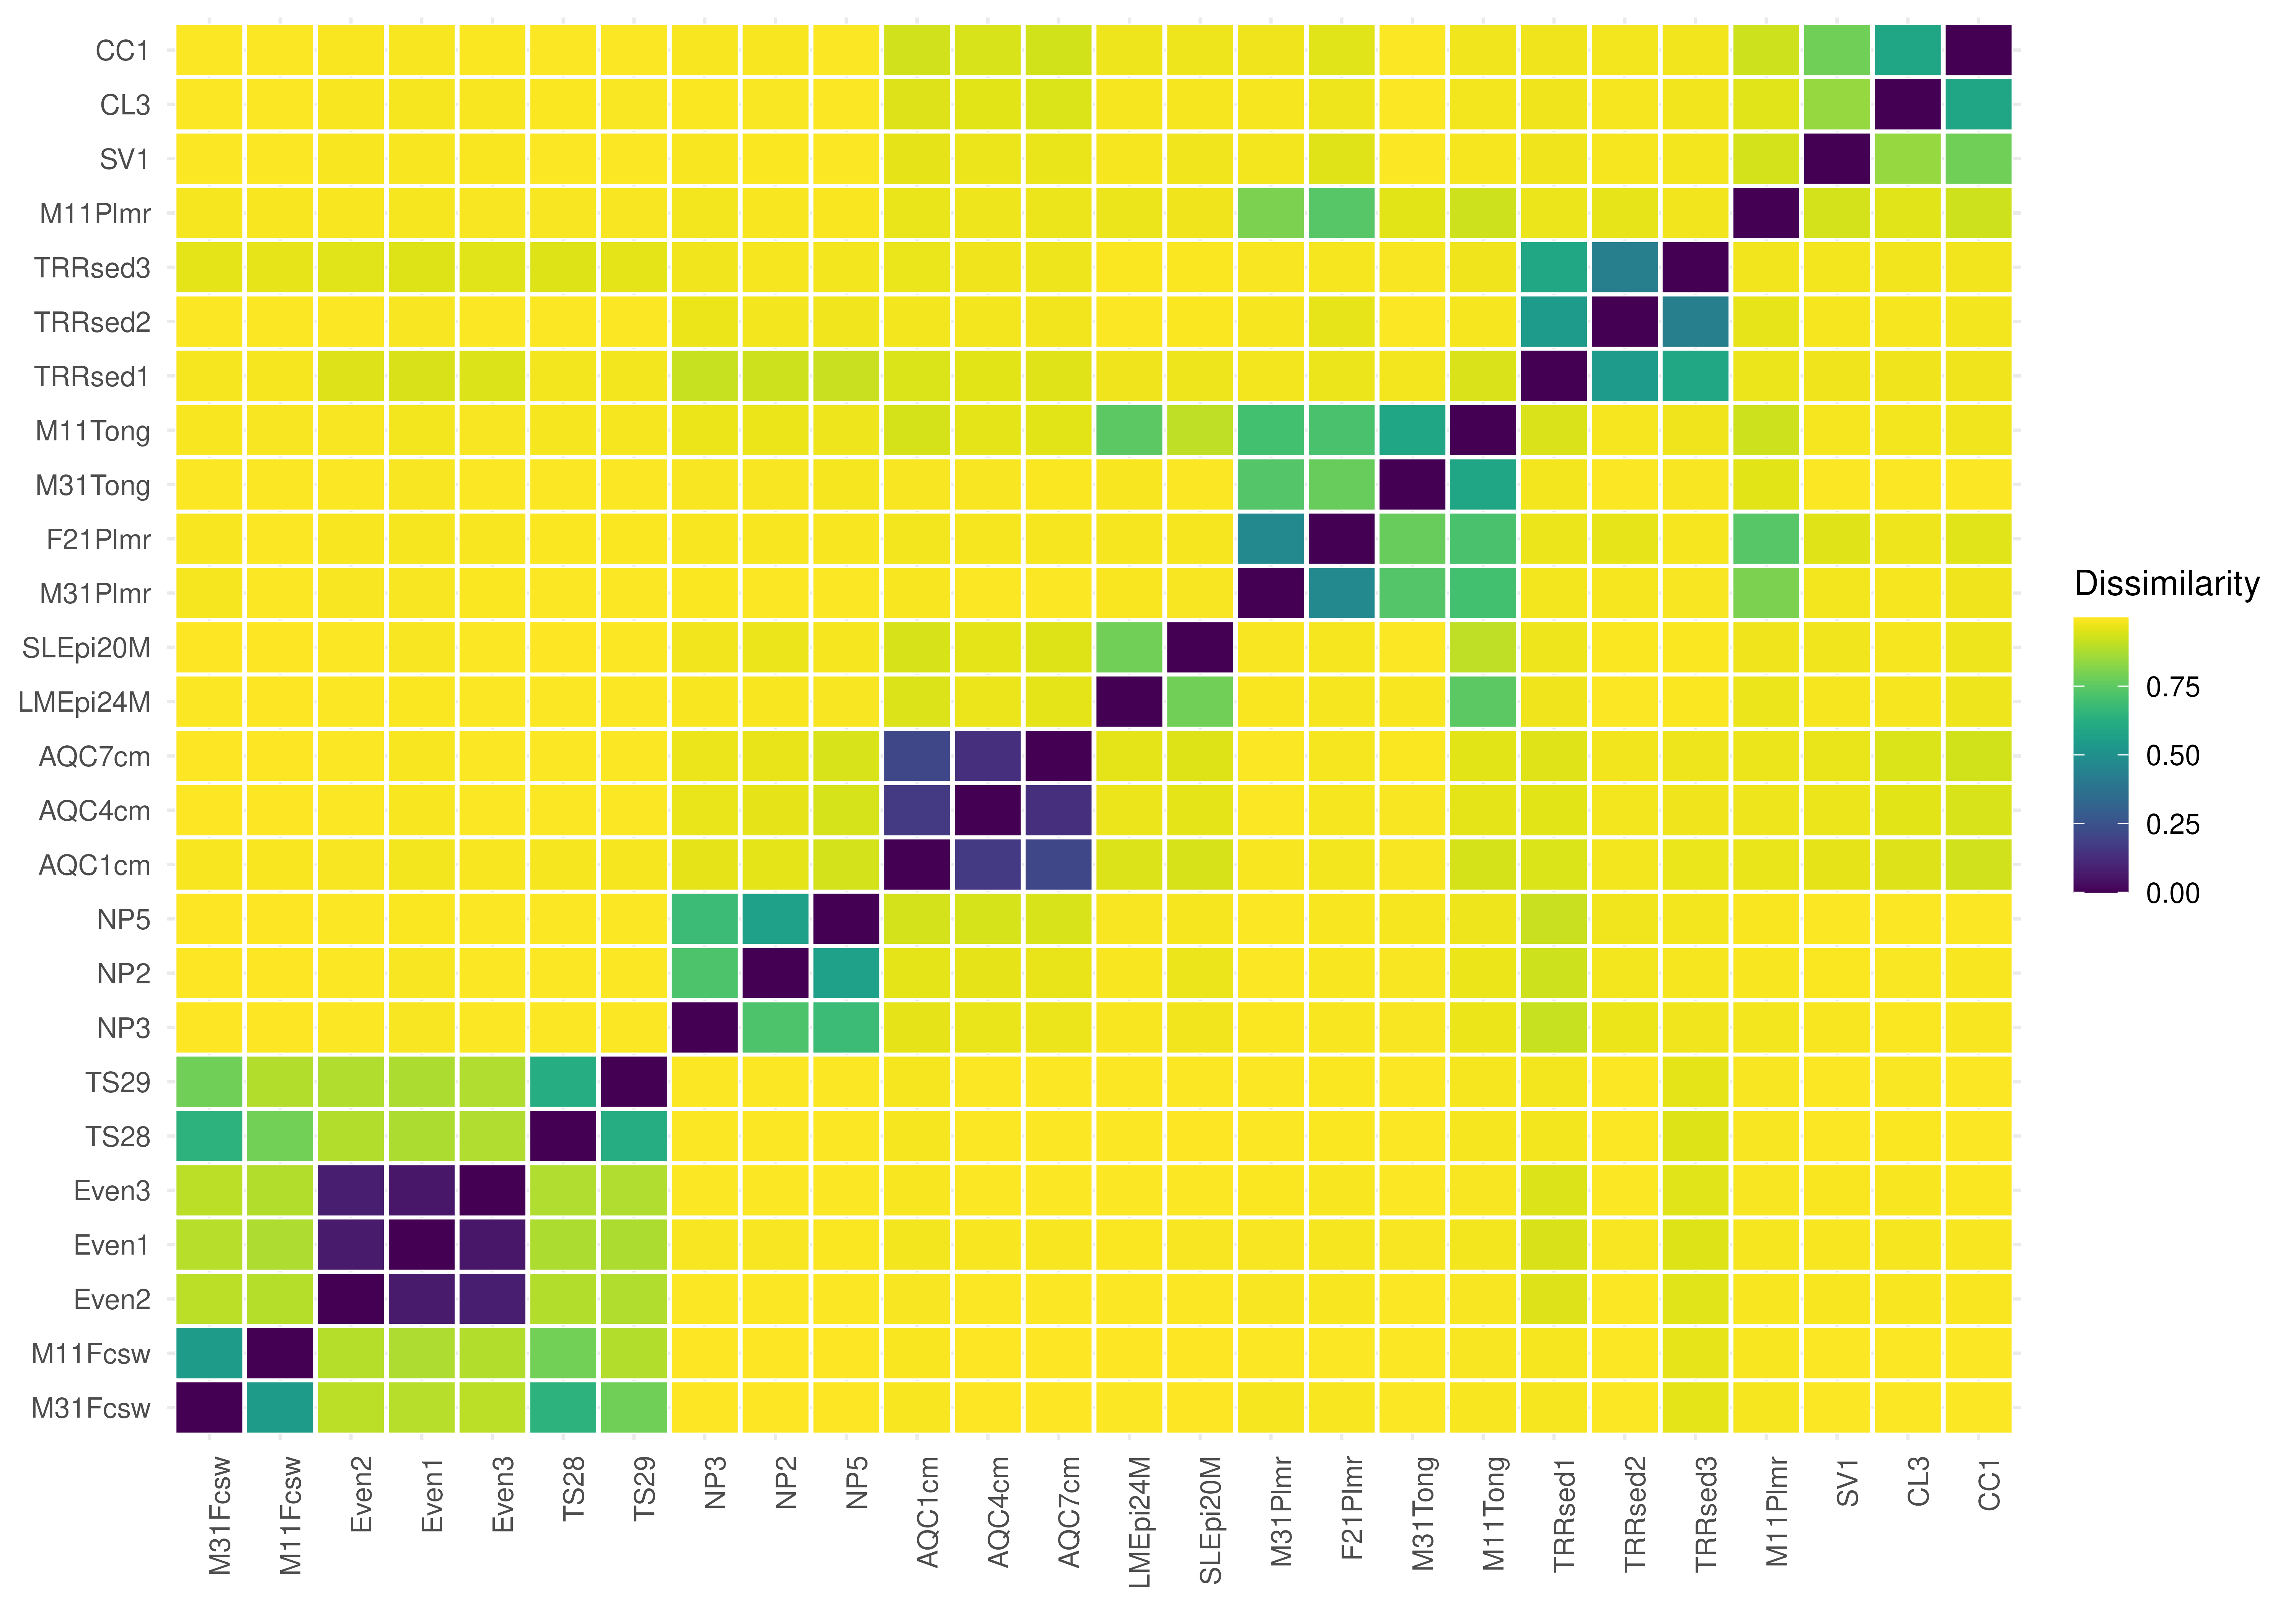
heatmap. Samples are ordered by hierarchical clustering so that similar
samples are next to each other.
plotDissimilarity(x, ...)

# S4 method for class 'SummarizedExperiment'
plotDissimilarity(x, name, col.var = NULL, ...)
Arguments
- x
- ...
Additional arguments passed to the facetting, for example
scalesandspace(both default"free").- name
Character scalar. Name of the dissimilarity matrix inmetadata(x). The matrix must be adistobject, as returned byaddDissimilarity, with one row per sample ofx.- col.var
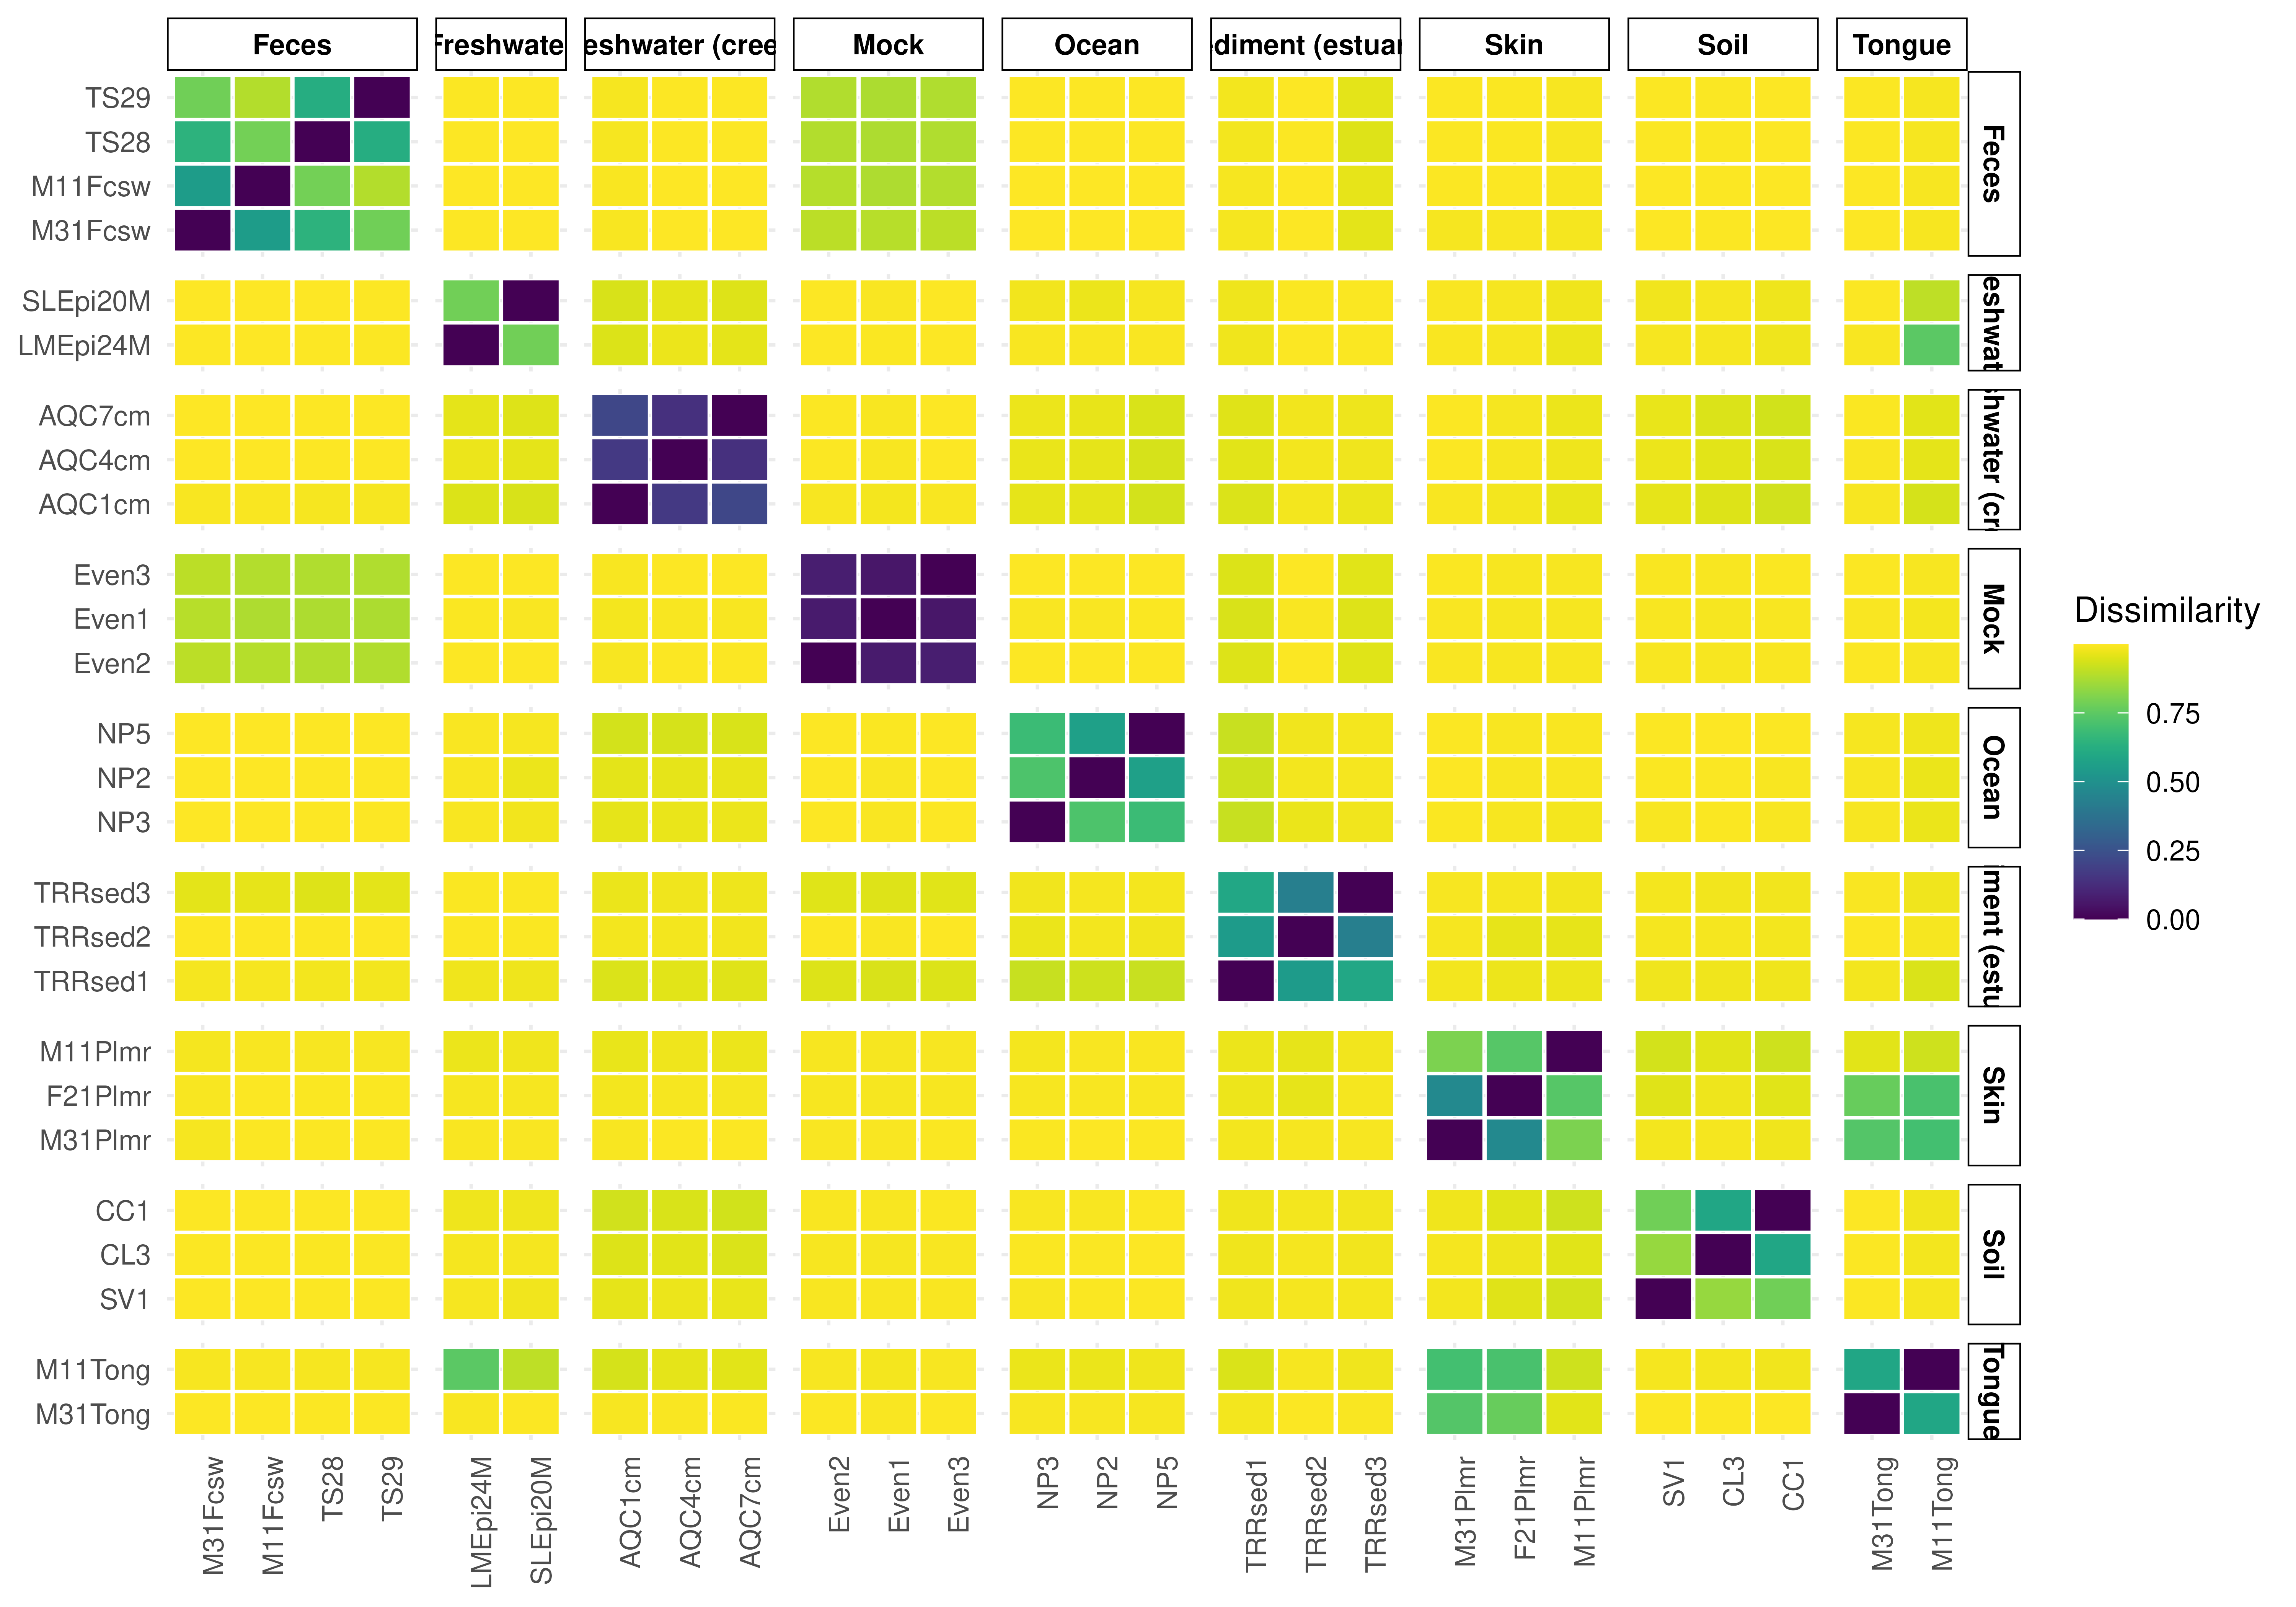
NULLorcharacter vector. Variables fromcolData(x)used for facetting. Because both axes are samples, the same variables split both the rows and the columns. (Default:NULL)
Value
A ggplot2 object.
See also
Examples
data(GlobalPatterns)
tse <- GlobalPatterns
tse <- transformAssay(tse, method = "relabundance")
# Calculate Bray-Curtis dissimilarity and store it in metadata
tse <- addDissimilarity(tse, method = "bray", assay.type = "relabundance")
plotDissimilarity(tse, "bray")
 # Split rows and columns by sample type
plotDissimilarity(tse, "bray", col.var = "SampleType")