Plotting igraph objects with information from a SummarizedExperiment
Source: R/AllGenerics.R, R/plotGraph.R
plotGraph.RdplotGraph plots an igraph object with additional information
matched from a SummarizedExperiment object for the nodes only.
Information on the edges have to provided manually.
plotColGraph(x, y, ...)

plotRowGraph(x, y, ...)

# S4 method for class 'ANY,SummarizedExperiment'
plotColGraph(
  x,
  y,
  show.label = show_label,
  show_label = FALSE,
  add.legend = add_legend,
  add_legend = TRUE,
  layout = "kk",
  edge.type = edge_type,
  edge_type = c("fan", "link", "arc", "parallel"),
  edge.colour.by = edge_colour_by,
  edge_colour_by = NULL,
  edge.width.by = edge_width_by,
  edge_width_by = NULL,
  colour.by = colour_by,
  colour_by = NULL,
  shape.by = shape_by,
  shape_by = NULL,
  size.by = size_by,
  size_by = NULL,
  assay.type = by_exprs_values,
  by_exprs_values = "counts",
  other.fields = other_fields,
  other_fields = list(),
  ...
)

# S4 method for class 'SummarizedExperiment,missing'
plotColGraph(x, y, name = "graph", ...)

# S4 method for class 'ANY,SummarizedExperiment'
plotRowGraph(
  x,
  y,
  show.label = show_label,
  show_label = FALSE,
  add.legend = add_legend,
  add_legend = TRUE,
  layout = "kk",
  edge.type = edge_type,
  edge_type = c("fan", "link", "arc", "parallel"),
  edge.colour.by = edge_colour_by,
  edge_colour_by = NULL,
  edge.width.by = edge_width_by,
  edge_width_by = NULL,
  colour.by = colour_by,
  colour_by = NULL,
  shape.by = shape_by,
  shape_by = NULL,
  size.by = NULL,
  assay.type = by_exprs_values,
  by_exprs_values = "counts",
  other.fields = other_fields,
  other_fields = list(),
  ...
)

# S4 method for class 'SummarizedExperiment,missing'
plotRowGraph(x, y, name = "graph", ...)
Arguments
- x, y
a graph object and a
SummarizedExperimentobject or just aSummarizedExperiment. For the latter object a graph object must be stored inmetadata(x)$name.- ...
additional arguments for plotting. See
mia-plot-argsfor more details i.e. callhelp("mia-plot-args")- show.label
Logical scalar,integer vectororcharacter vectorIf alogicalscalar is given, should tip labels be plotted or if a logical vector is provided, which labels should be shown? If anintegerorcharactervector is provided, it will be converted to a logical vector. Theintegervalues must be in the range of 1 and number of nodes, whereas the values of acharactervector must match values of alabelornamecolumn in the node data. In case of acharactervector only values corresponding to actual labels will be plotted and if no labels are provided no labels will be shown. (Default:FALSE)- show_label
Deprecated. Use
show.labelinstead.- add.legend
Logical scalar. Should legends be plotted? (Default:TRUE)- add_legend
Deprecated. Use
add.legendinstead.- layout
Character scalar. Layout for the plotted graph. Seeggraphfor details. (Default:"kk")- edge.type
Character scalar. Type of edge plotted on the graph. Seegeom_edge_fanfor details and other available geoms. (Default:"fan")- edge_type
Deprecated. Use
edge.typeinstead.- edge.colour.by
Character scalar. Specification of an edge metadata field to use for setting colours of the edges. (Default:NULL)- edge_colour_by
Deprecated. Use
edge.colour.byinstead.- edge.width.by
Character scalar. Specification of an edge metadata field to use for setting width of the edges. (Default:NULL)- edge_width_by
Deprecated. Use
edge.width.byinstead.- colour.by
Character scalar. Specification of a column metadata field or a feature to colour graph nodes by, see the by argument in?retrieveCellInfofor possible values. (Default:NULL)- colour_by
Deprecated. Use
colour.byinstead.- shape.by
Character scalar. Specification of a column metadata field or a feature to shape graph nodes by, see the by argument in?retrieveCellInfofor possible values. (Default:NULL)- shape_by
Deprecated. Use
shape.byinstead.- size.by
Character scalar. Specification of a column metadata field or a feature to size graph nodes by, see the by argument in?retrieveCellInfofor possible values. (Default:NULL)- size_by
Deprecated. Use
size.byinstead.- assay.type
Character scalar. orinteger scalar. Specifies which assay to obtain expression values from, for use in point aesthetics - see theexprs_valuesargument in?retrieveCellInfo. (Default:"counts")- by_exprs_values
Deprecated. Use
assay.typeinstead.- other.fields
Additional fields to include in the node information without plotting them.
- other_fields
Deprecated. Use
other.fieldsinstead.- name
Character scalar. Ifxis aSummarizedExperimentthe key for subsetting themetadata(x)to a graph object. (Default:"graph")
Value
a ggtree plot
Details
Internally tidygraph and ggraph are used. Therefore, all
graph types which can be converted by tidygraph::as_tbl_graph can
be used.
Examples
# \donttest{
# data setup
library(mia)
data(GlobalPatterns)
data(col_graph)
data(row_graph)
data(row_graph_order)
metadata(GlobalPatterns)$col_graph <- col_graph
genus <- agglomerateByRank(GlobalPatterns,"Genus",na.rm=TRUE)
#> Duplicated labels were made unique.
metadata(genus)$row_graph <- row_graph
order <- agglomerateByRank(genus,"Order",na.rm=TRUE)
#> Warning: The following values are already present in `metadata` and will be overwritten: 'agglomerated_by_rank'. Consider using the 'name' argument to specify alternative names.
metadata(order)$row_graph <- row_graph_order
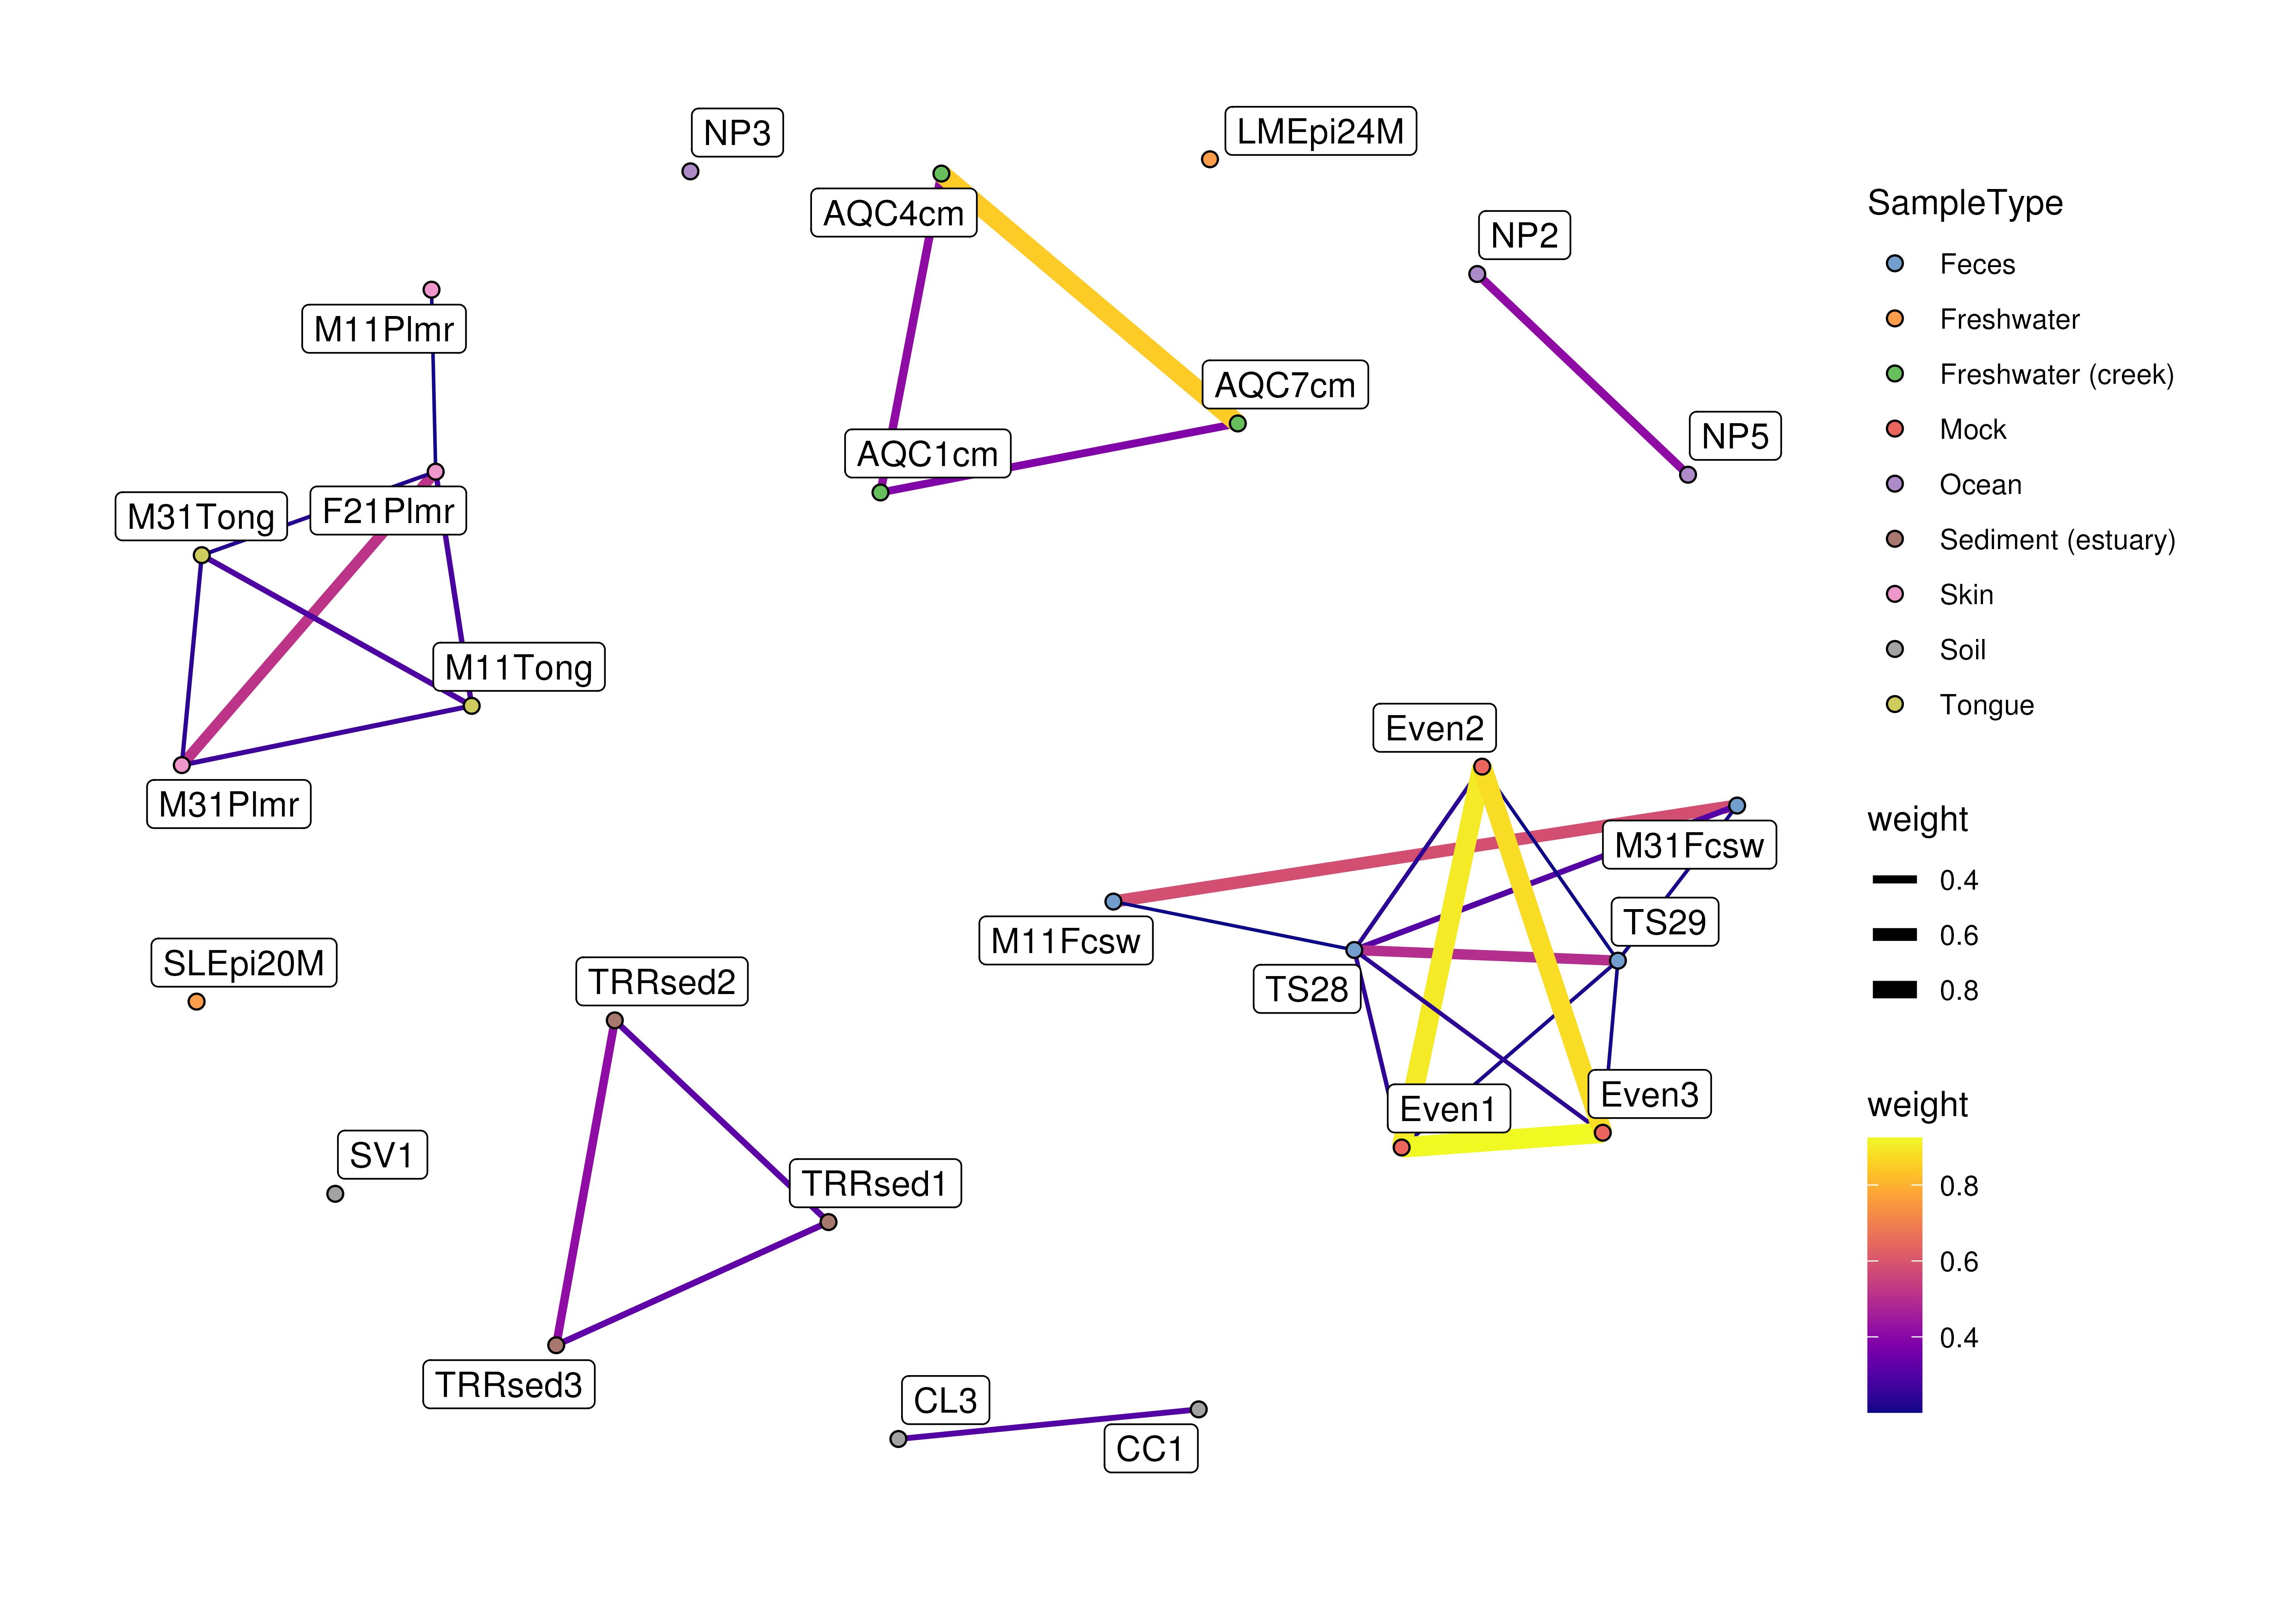
# plot a graph independently
plotColGraph(col_graph,
genus,
colour.by = "SampleType",
edge.colour.by = "weight",
edge.width.by = "weight",
show.label = TRUE)
#> This graph was created by an old(er) igraph version.
#> ℹ Call `igraph::upgrade_graph()` on it to use with the current igraph version.
#> For now we convert it on the fly...
 # plot the graph stored in the object
plotColGraph(genus,
name = "col_graph",
colour.by = "SampleType",
edge.colour.by = "weight",
edge.width.by = "weight")
# plot the graph stored in the object
plotColGraph(genus,
name = "col_graph",
colour.by = "SampleType",
edge.colour.by = "weight",
edge.width.by = "weight")
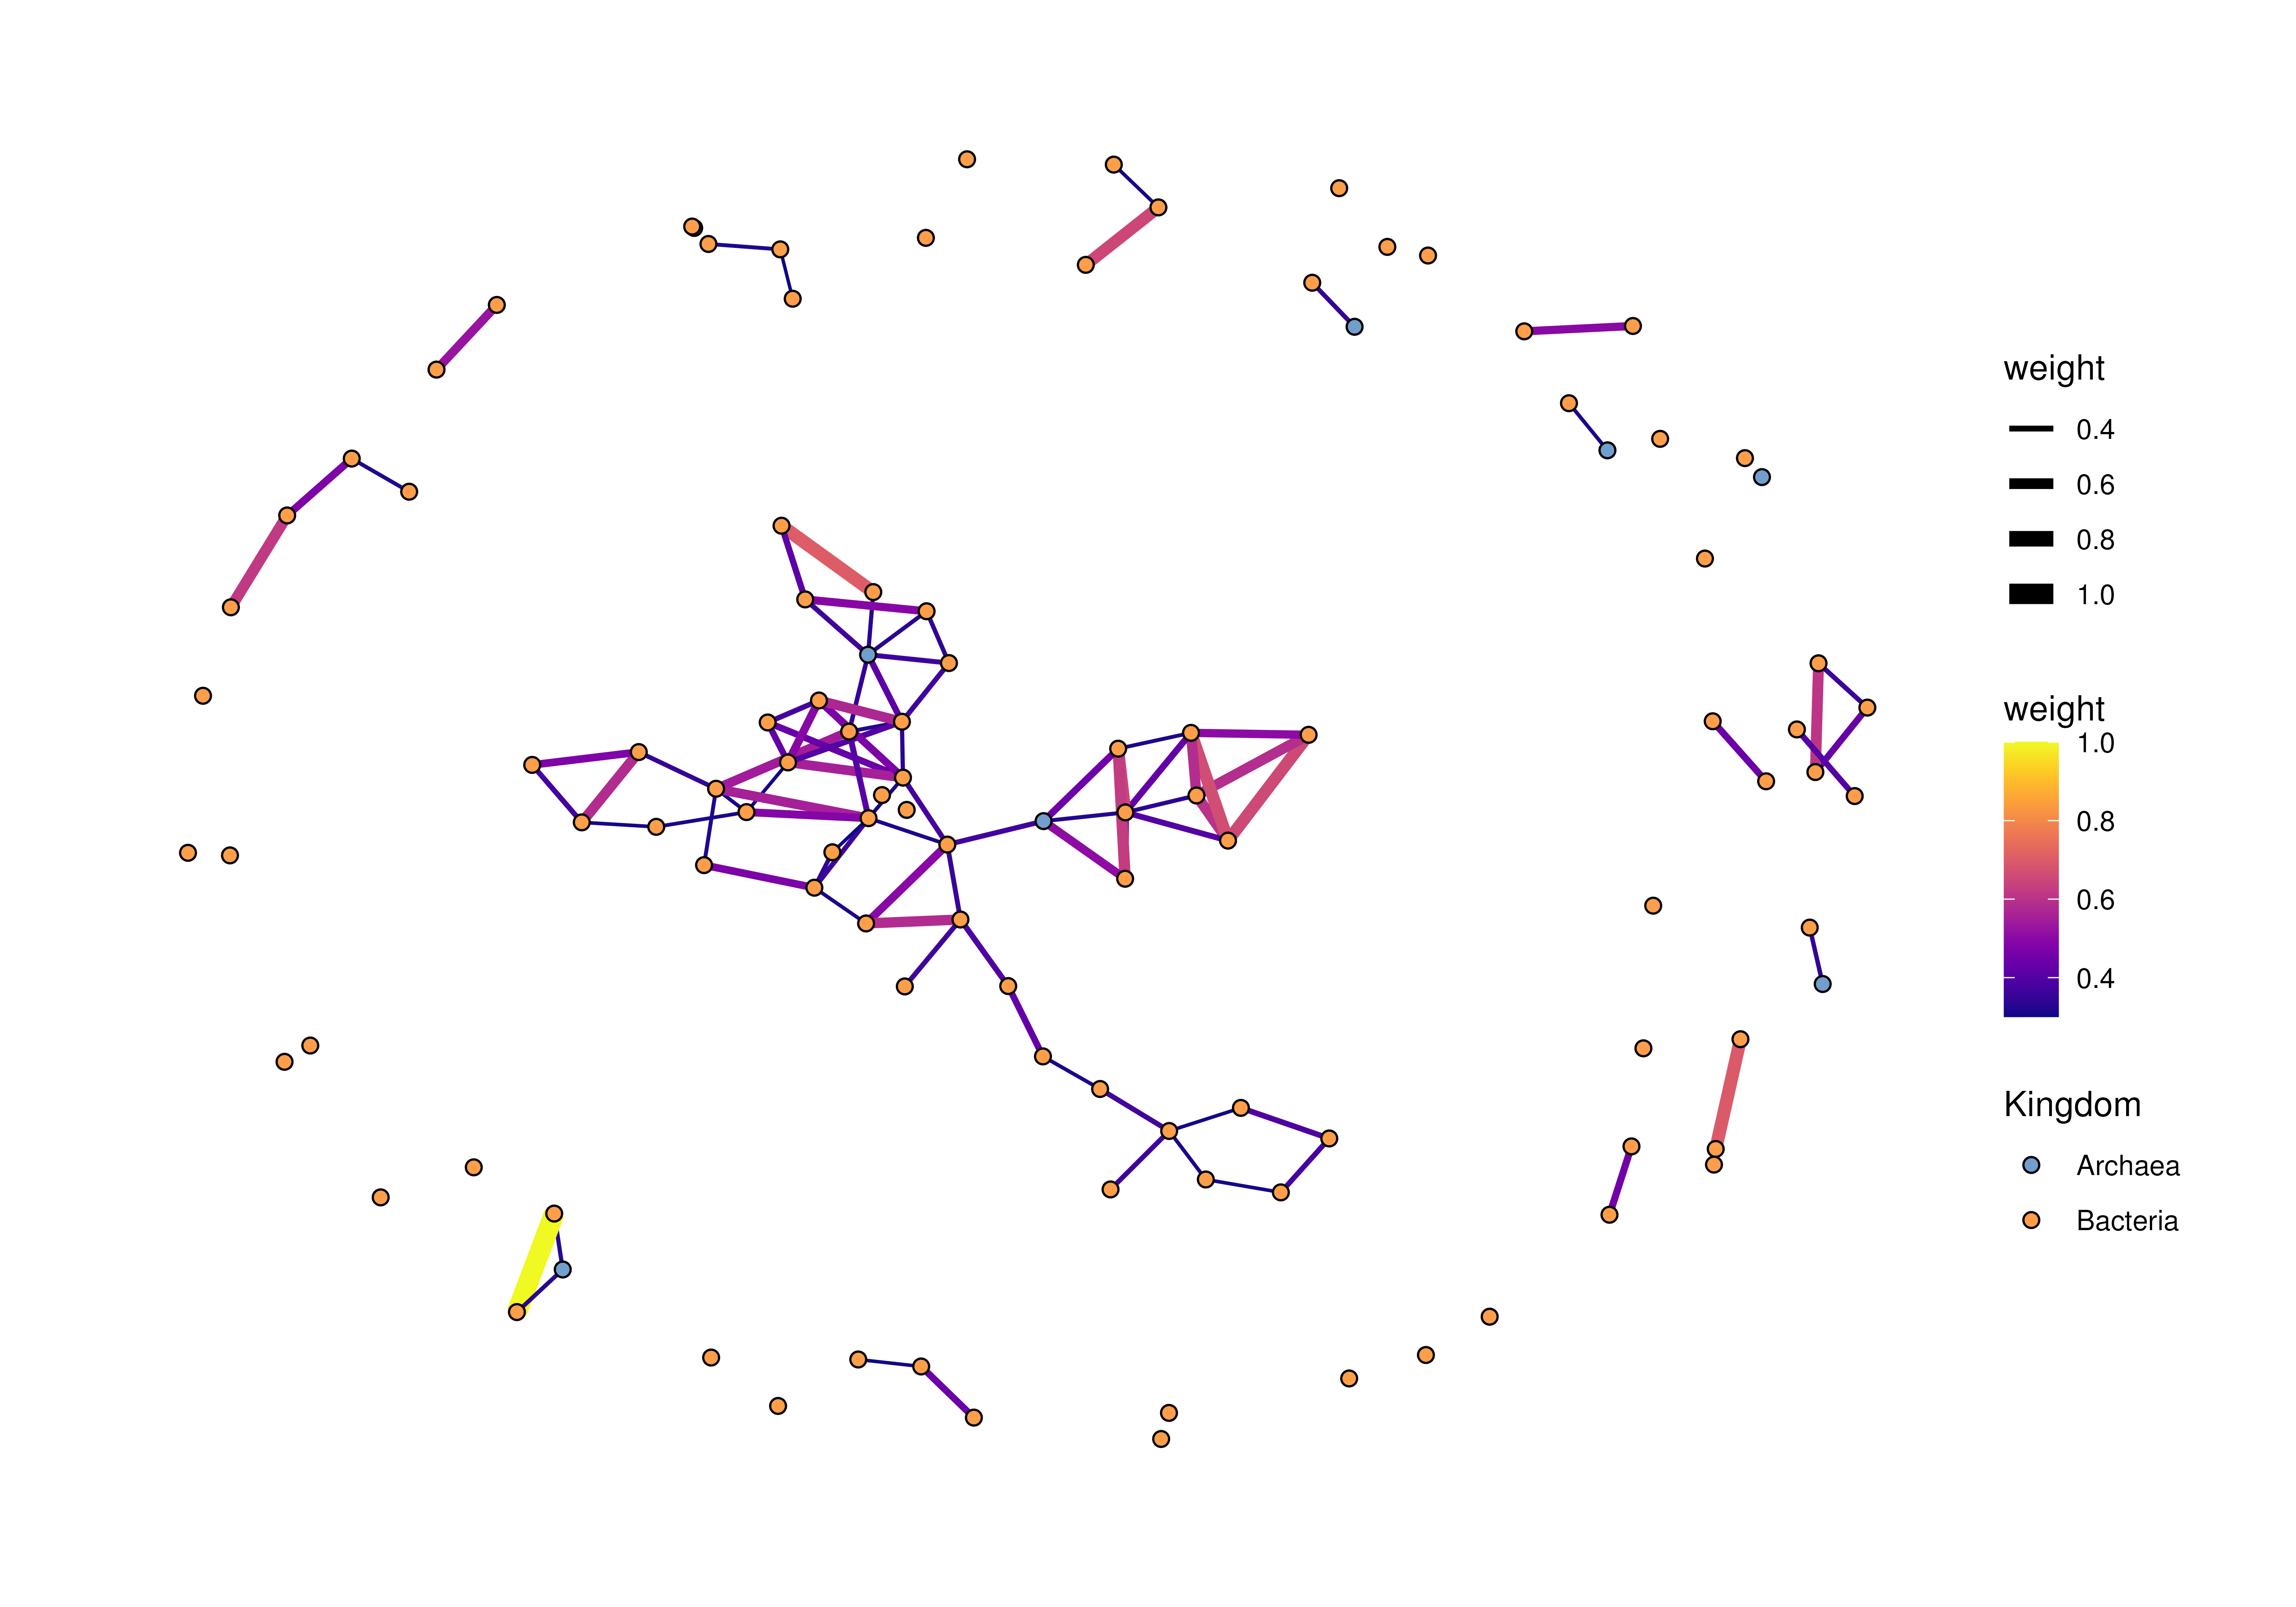
 # plot a graph independently
plotRowGraph(row_graph,
genus,
colour.by = "Kingdom",
edge.colour.by = "weight",
edge.width.by = "weight")
#> This graph was created by an old(er) igraph version.
#> ℹ Call `igraph::upgrade_graph()` on it to use with the current igraph version.
#> For now we convert it on the fly...
# plot a graph independently
plotRowGraph(row_graph,
genus,
colour.by = "Kingdom",
edge.colour.by = "weight",
edge.width.by = "weight")
#> This graph was created by an old(er) igraph version.
#> ℹ Call `igraph::upgrade_graph()` on it to use with the current igraph version.
#> For now we convert it on the fly...
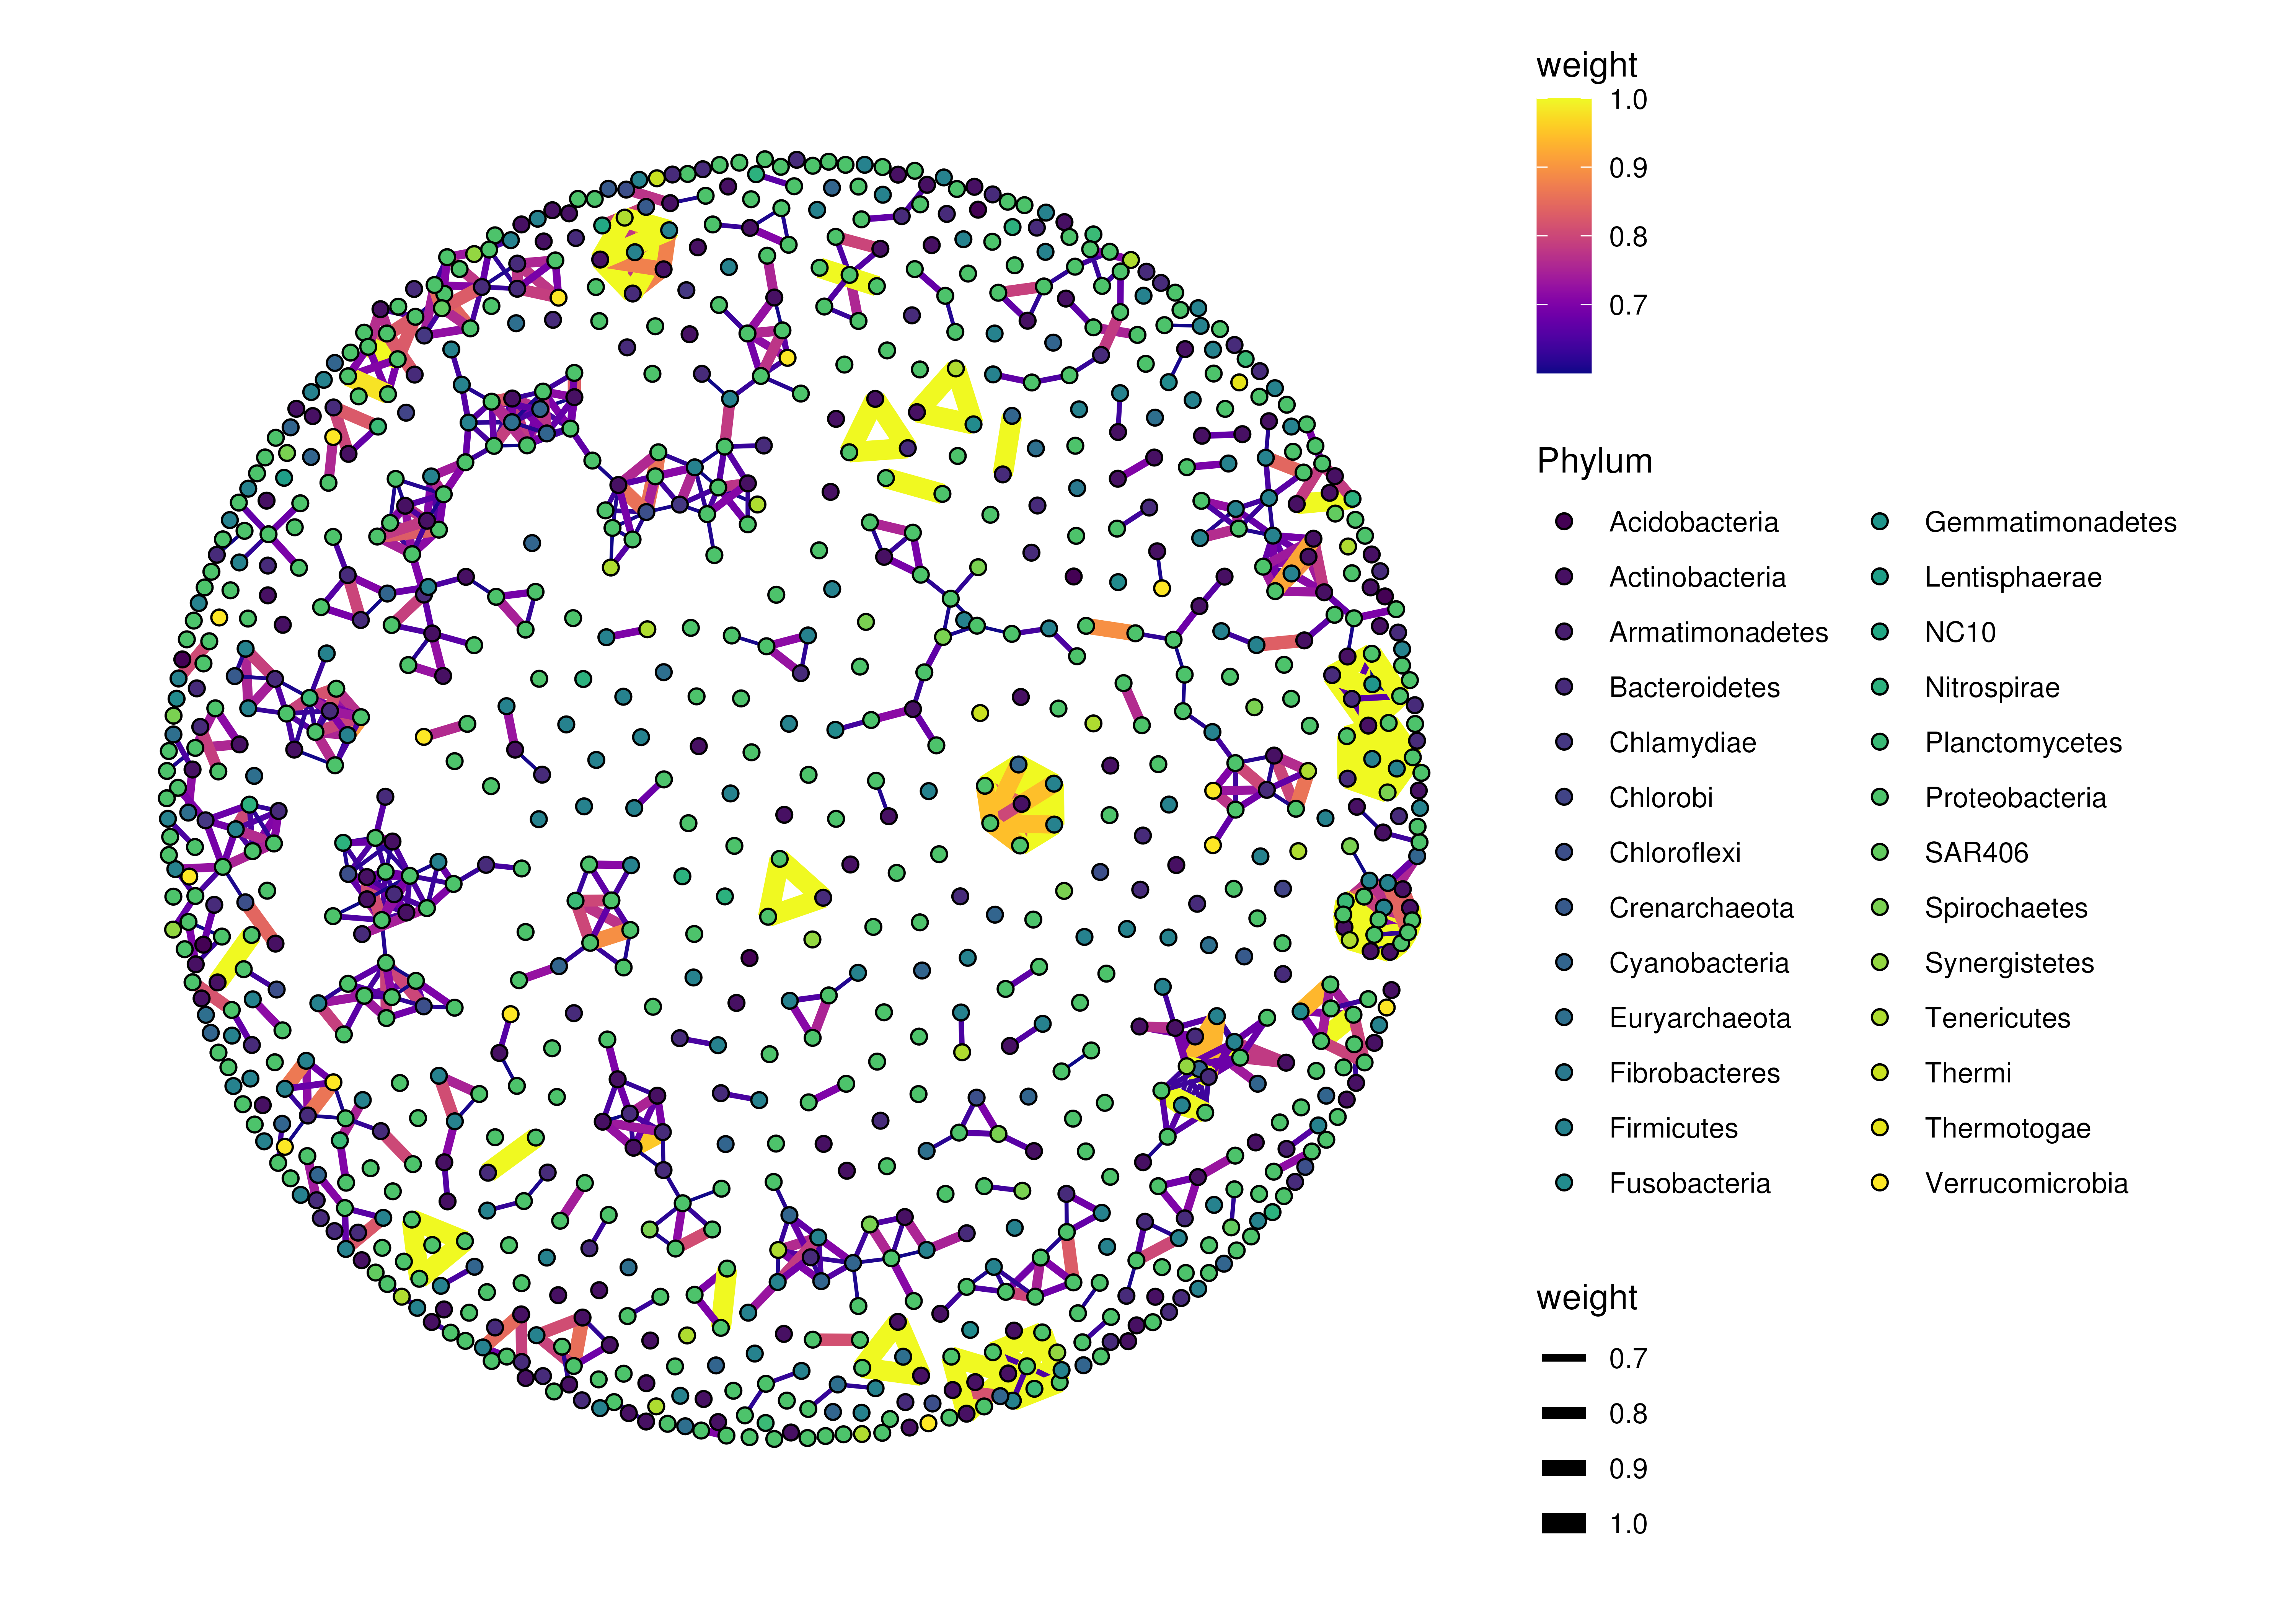
 # plot the graph stored in the object
plotRowGraph(genus,
name = "row_graph",
colour.by = "Phylum",
edge.colour.by = "weight",
edge.width.by = "weight")
# plot the graph stored in the object
plotRowGraph(genus,
name = "row_graph",
colour.by = "Phylum",
edge.colour.by = "weight",
edge.width.by = "weight")
 # plot a graph independently
plotRowGraph(row_graph_order,
order,
colour.by = "Kingdom",
edge.colour.by = "weight",
edge.width.by = "weight")
#> This graph was created by an old(er) igraph version.
#> ℹ Call `igraph::upgrade_graph()` on it to use with the current igraph version.
#> For now we convert it on the fly...
# plot a graph independently
plotRowGraph(row_graph_order,
order,
colour.by = "Kingdom",
edge.colour.by = "weight",
edge.width.by = "weight")
#> This graph was created by an old(er) igraph version.
#> ℹ Call `igraph::upgrade_graph()` on it to use with the current igraph version.
#> For now we convert it on the fly...
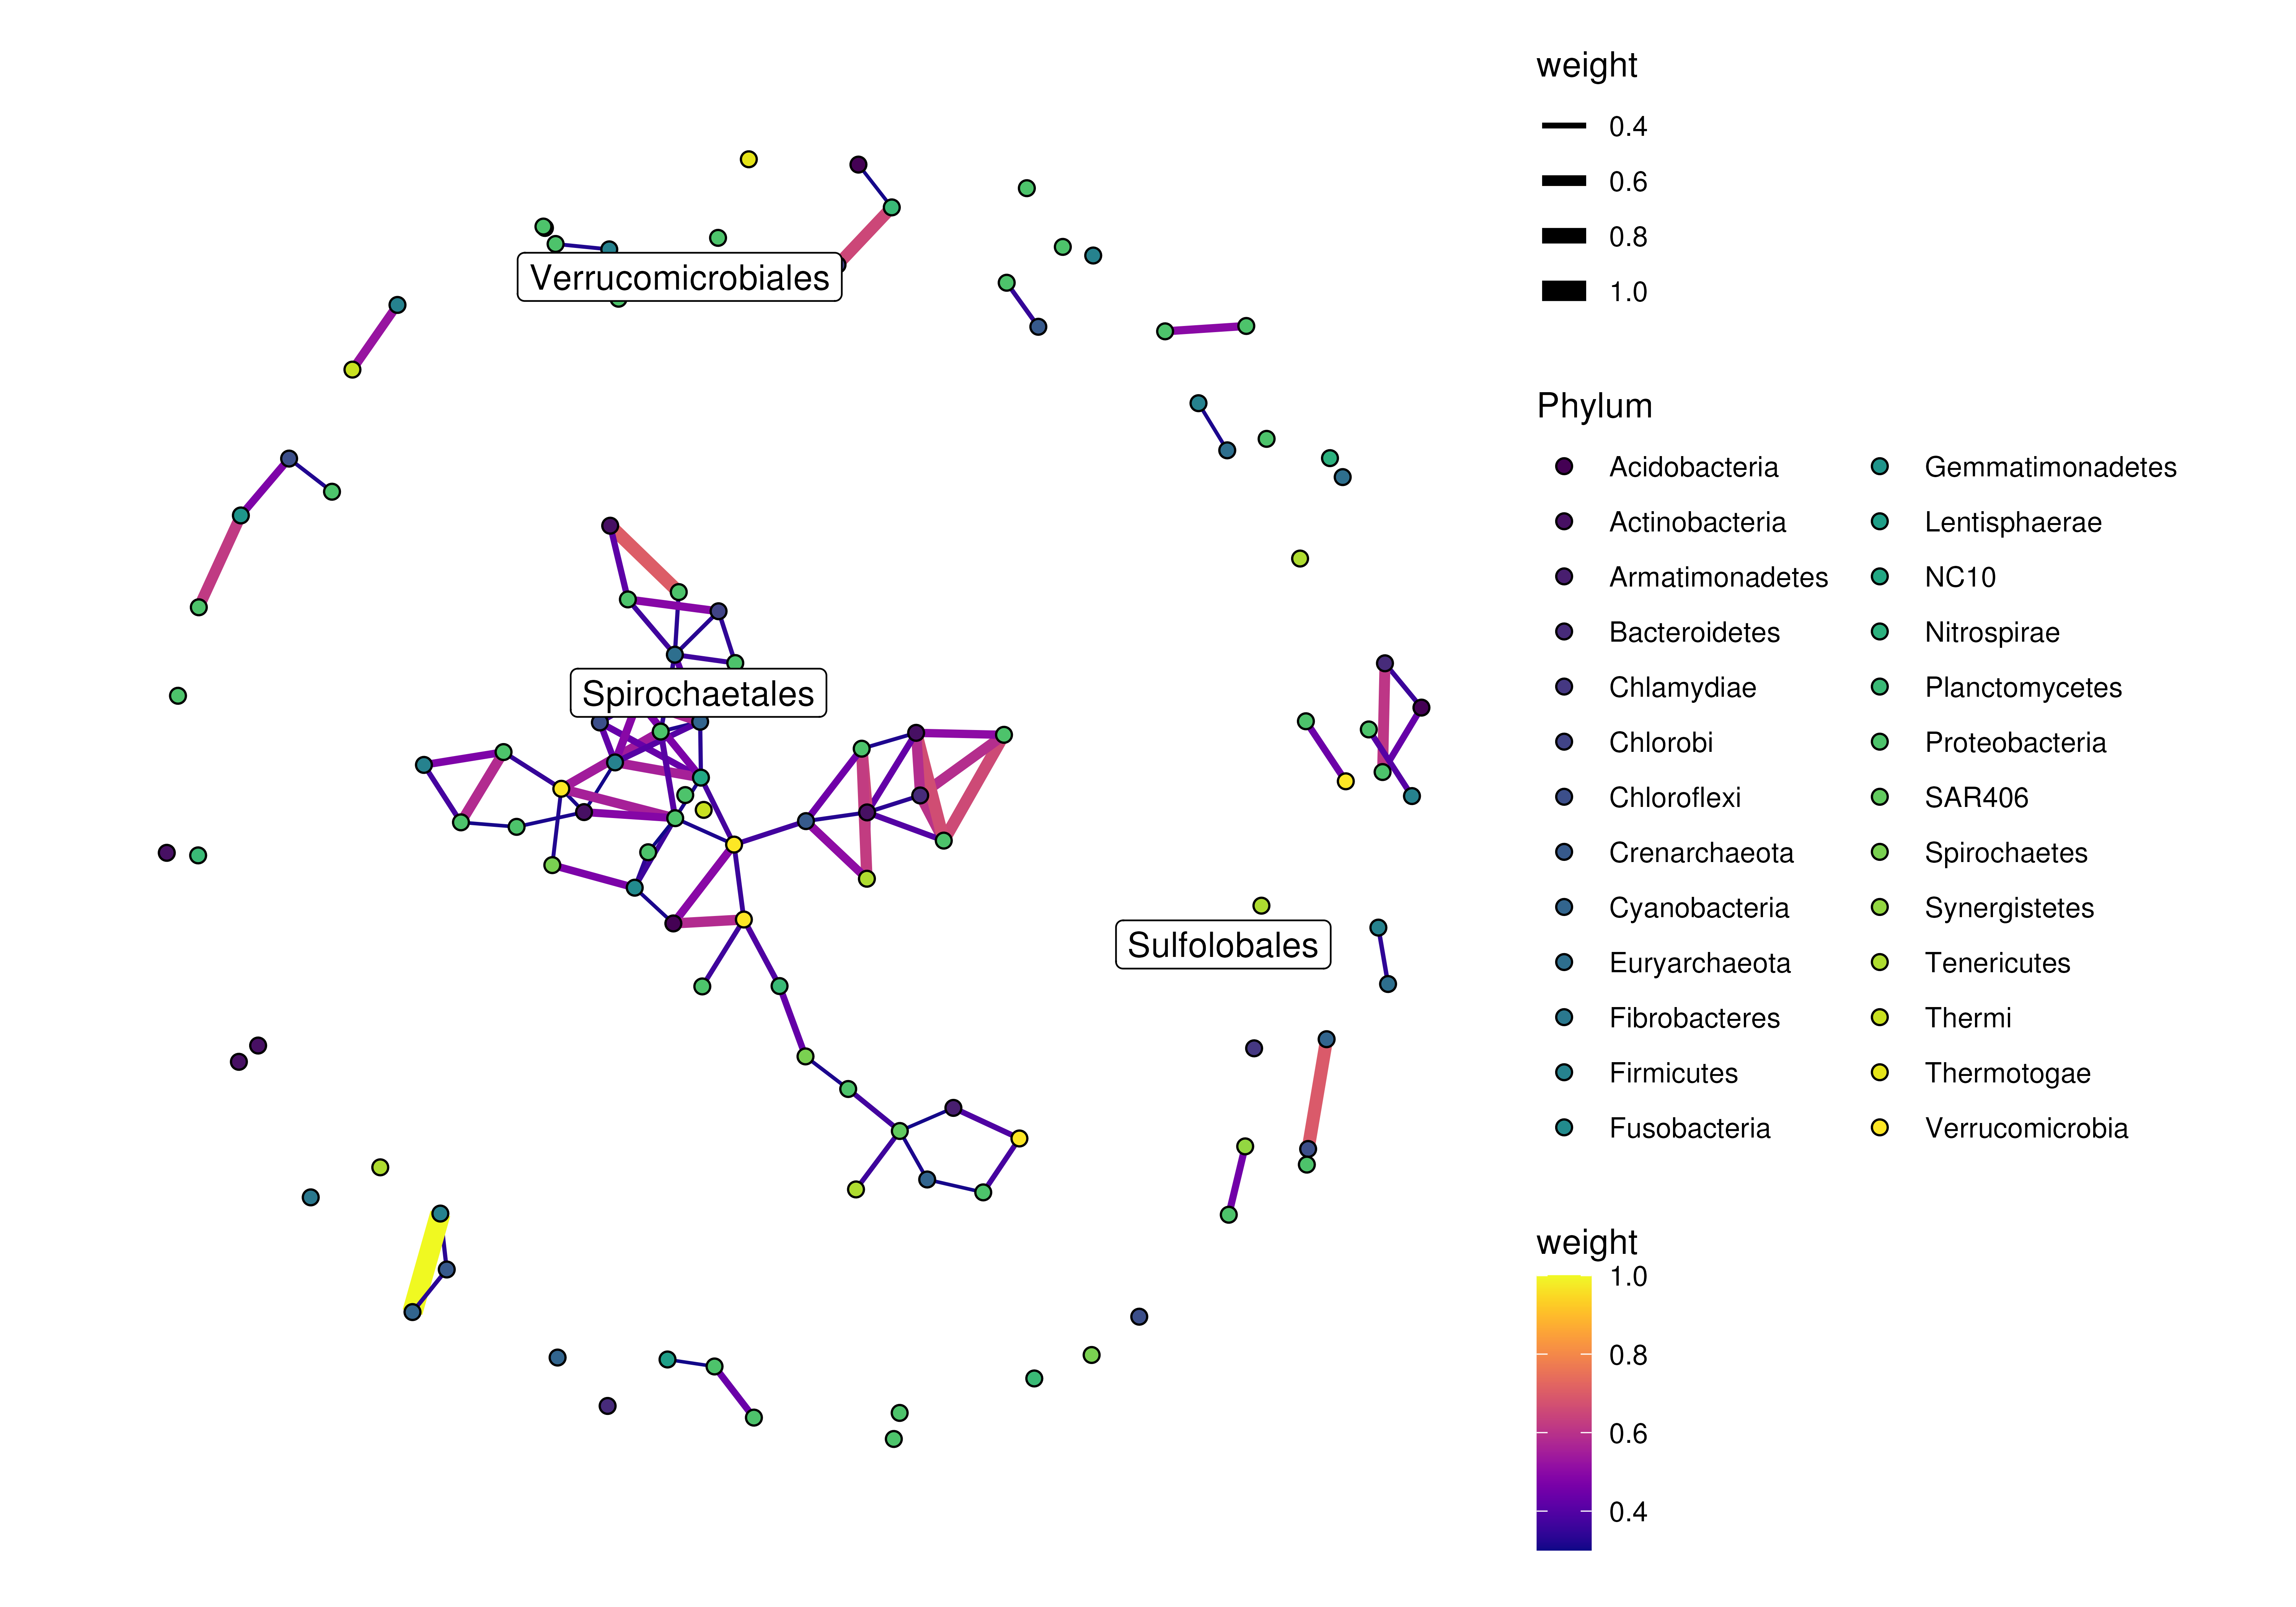
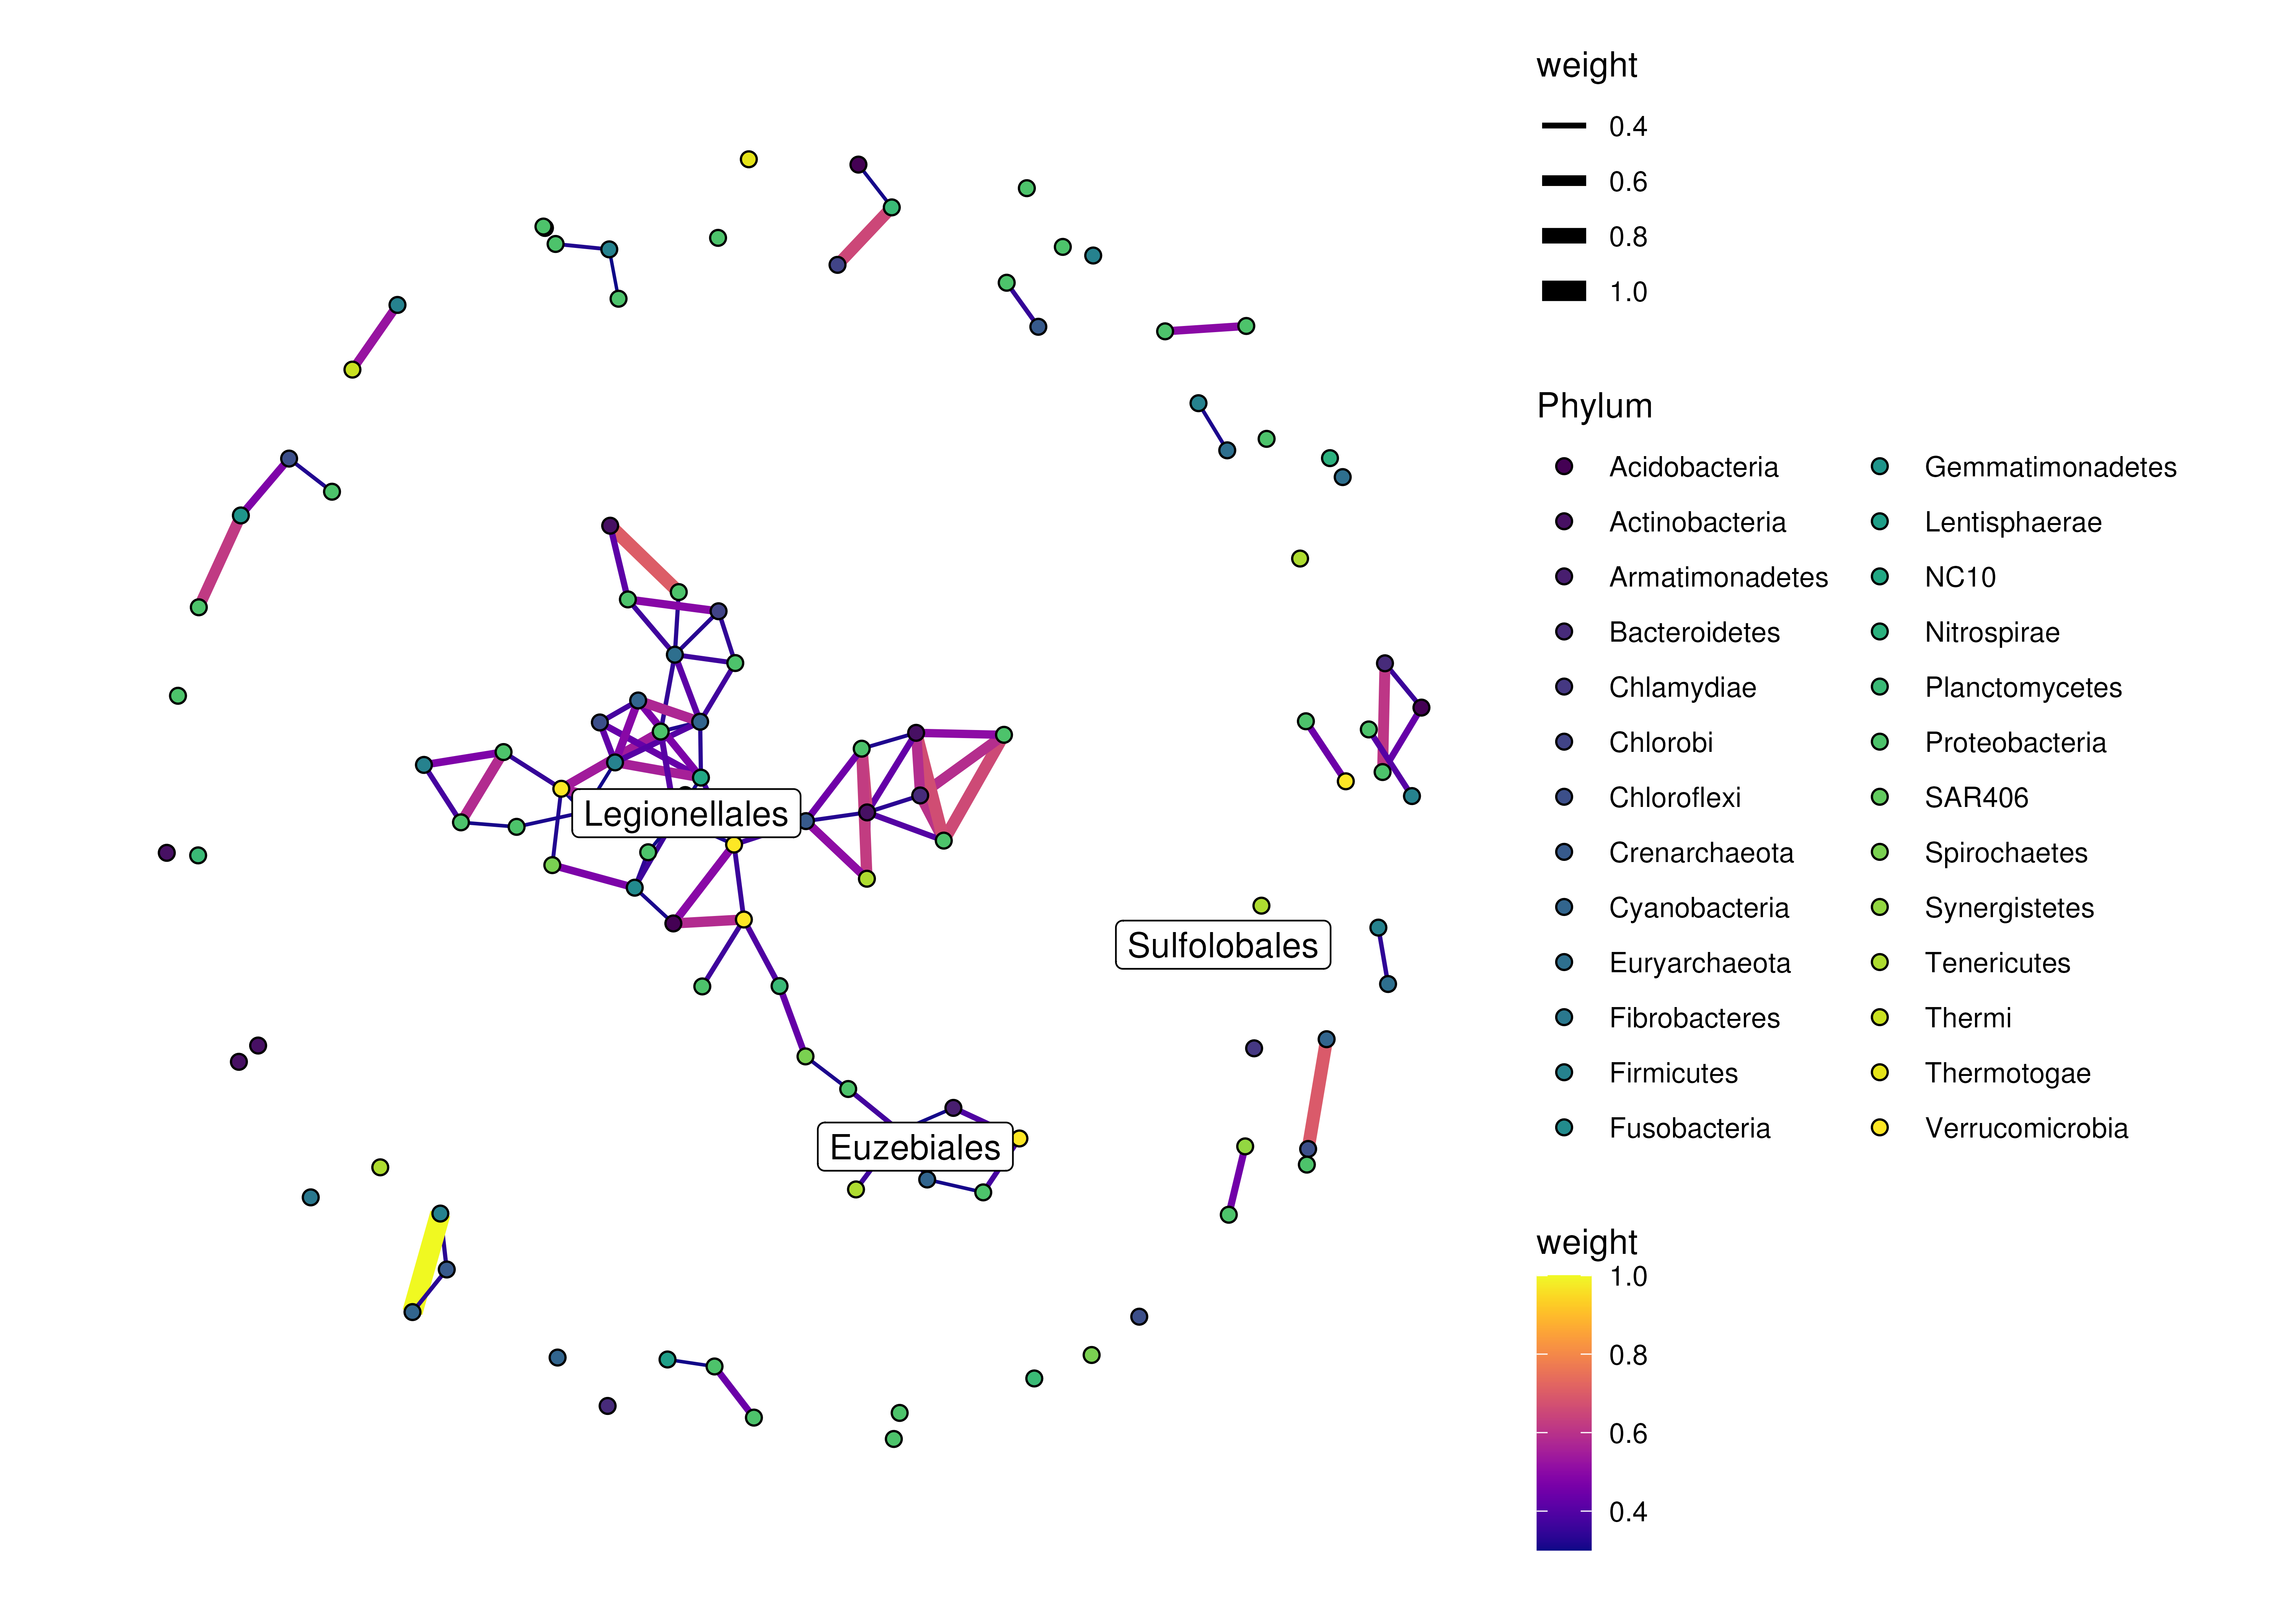
 # plot the graph stored in the object and include some labels
plotRowGraph(order,
name = "row_graph",
colour.by = "Phylum",
edge.colour.by = "weight",
edge.width.by = "weight",
show.label = c("Sulfolobales","Spirochaetales",
"Verrucomicrobiales"))
# plot the graph stored in the object and include some labels
plotRowGraph(order,
name = "row_graph",
colour.by = "Phylum",
edge.colour.by = "weight",
edge.width.by = "weight",
show.label = c("Sulfolobales","Spirochaetales",
"Verrucomicrobiales"))
 # labels can also be included via selecting specific rownames of x/y
plotRowGraph(order,
name = "row_graph",
colour.by = "Phylum",
edge.colour.by = "weight",
edge.width.by = "weight",
show.label = c(1,10,50))
# labels can also be included via selecting specific rownames of x/y
plotRowGraph(order,
name = "row_graph",
colour.by = "Phylum",
edge.colour.by = "weight",
edge.width.by = "weight",
show.label = c(1,10,50))
 # labels can also be included via a logical vector, which has the same length
# as nodes are present
label_select <- rep(FALSE,nrow(order))
label_select[c(1,10,50)] <- TRUE
plotRowGraph(order,
name = "row_graph",
colour.by = "Phylum",
edge.colour.by = "weight",
edge.width.by = "weight",
show.label = label_select)
# labels can also be included via a logical vector, which has the same length
# as nodes are present
label_select <- rep(FALSE,nrow(order))
label_select[c(1,10,50)] <- TRUE
plotRowGraph(order,
name = "row_graph",
colour.by = "Phylum",
edge.colour.by = "weight",
edge.width.by = "weight",
show.label = label_select)
 # }
# }