Plot feature loadings for TreeSummarizedExperiment objects or feature loadings numeric matrix.
Source:R/AllGenerics.R, R/plotLoadings.R
plotLoadings.RdThis function is used after performing a reduction method. If TreeSE
is given it retrieves the feature loadings matrix to plot values.
A tree from rowTree can be added to heatmap layout.
plotLoadings(x, ...)

# S4 method for class 'TreeSummarizedExperiment'
plotLoadings(
  x,
  dimred,
  layout = "barplot",
  ncomponents = 5,
  tree.name = "phylo",
  row.var = NULL,
  add.tree = FALSE,
  ...
)

# S4 method for class 'SingleCellExperiment'
plotLoadings(x, dimred, layout = "barplot", ncomponents = 5, ...)

# S4 method for class 'matrix'
plotLoadings(x, layout = "barplot", ncomponents = 5, ...)
Arguments
- x
- ...
additional parameters for plotting.
n:Integer scalar. Number of features to be plotted. Applicable whenlayout="barplot". (Default:min(nrow(x), 10L)))absolute.scale: ("barplot", "lollipop")Logical scalar. Specifies whether a barplot or a lollipop plot should be visualized in absolute scale. (Default:TRUE)
- dimred
Character scalar. Determines the reduced dimension to plot.- layout
Character scalar. Determines the layout of plot. Must be either"barplot","heatmap", or"lollipop". (Default:"barplot")- ncomponents
Numeric scalar. Number of components must be lower or equal to the number of components chosen in the reduction method. (Default:5)- tree.name
Character scalar. Specifies a rowTree/colTree fromx. (Default:tree.name = "phylo")- row.var
NULLorCharacter scalar. Specifies a variable fromrowDatato plot with tree heatmap layout. (Default:NULL)- add.tree
Logical scalar. Whether to add tree to heatmap layout. (Default:FALSE)
Value
A ggplot2 object.
Details
These method visualize feature loadings of dimension reduction results.
Inspired by the plotASVcircular method using phyloseq.
TreeSummarizedExperiment object is expected to have
content in reducedDim slot calculated with standardized methods from
mia or scater package.
Examples
library(mia)
library(scater)
data("GlobalPatterns", package = "mia")
tse <- GlobalPatterns
# Calculate PCA
tse <- agglomerateByPrevalence(tse, rank="Phylum", update.tree = TRUE)
tse <- transformAssay(tse, method = "clr", pseudocount = 1)
tse <- runPCA(tse, ncomponents = 5, assay.type = "clr")
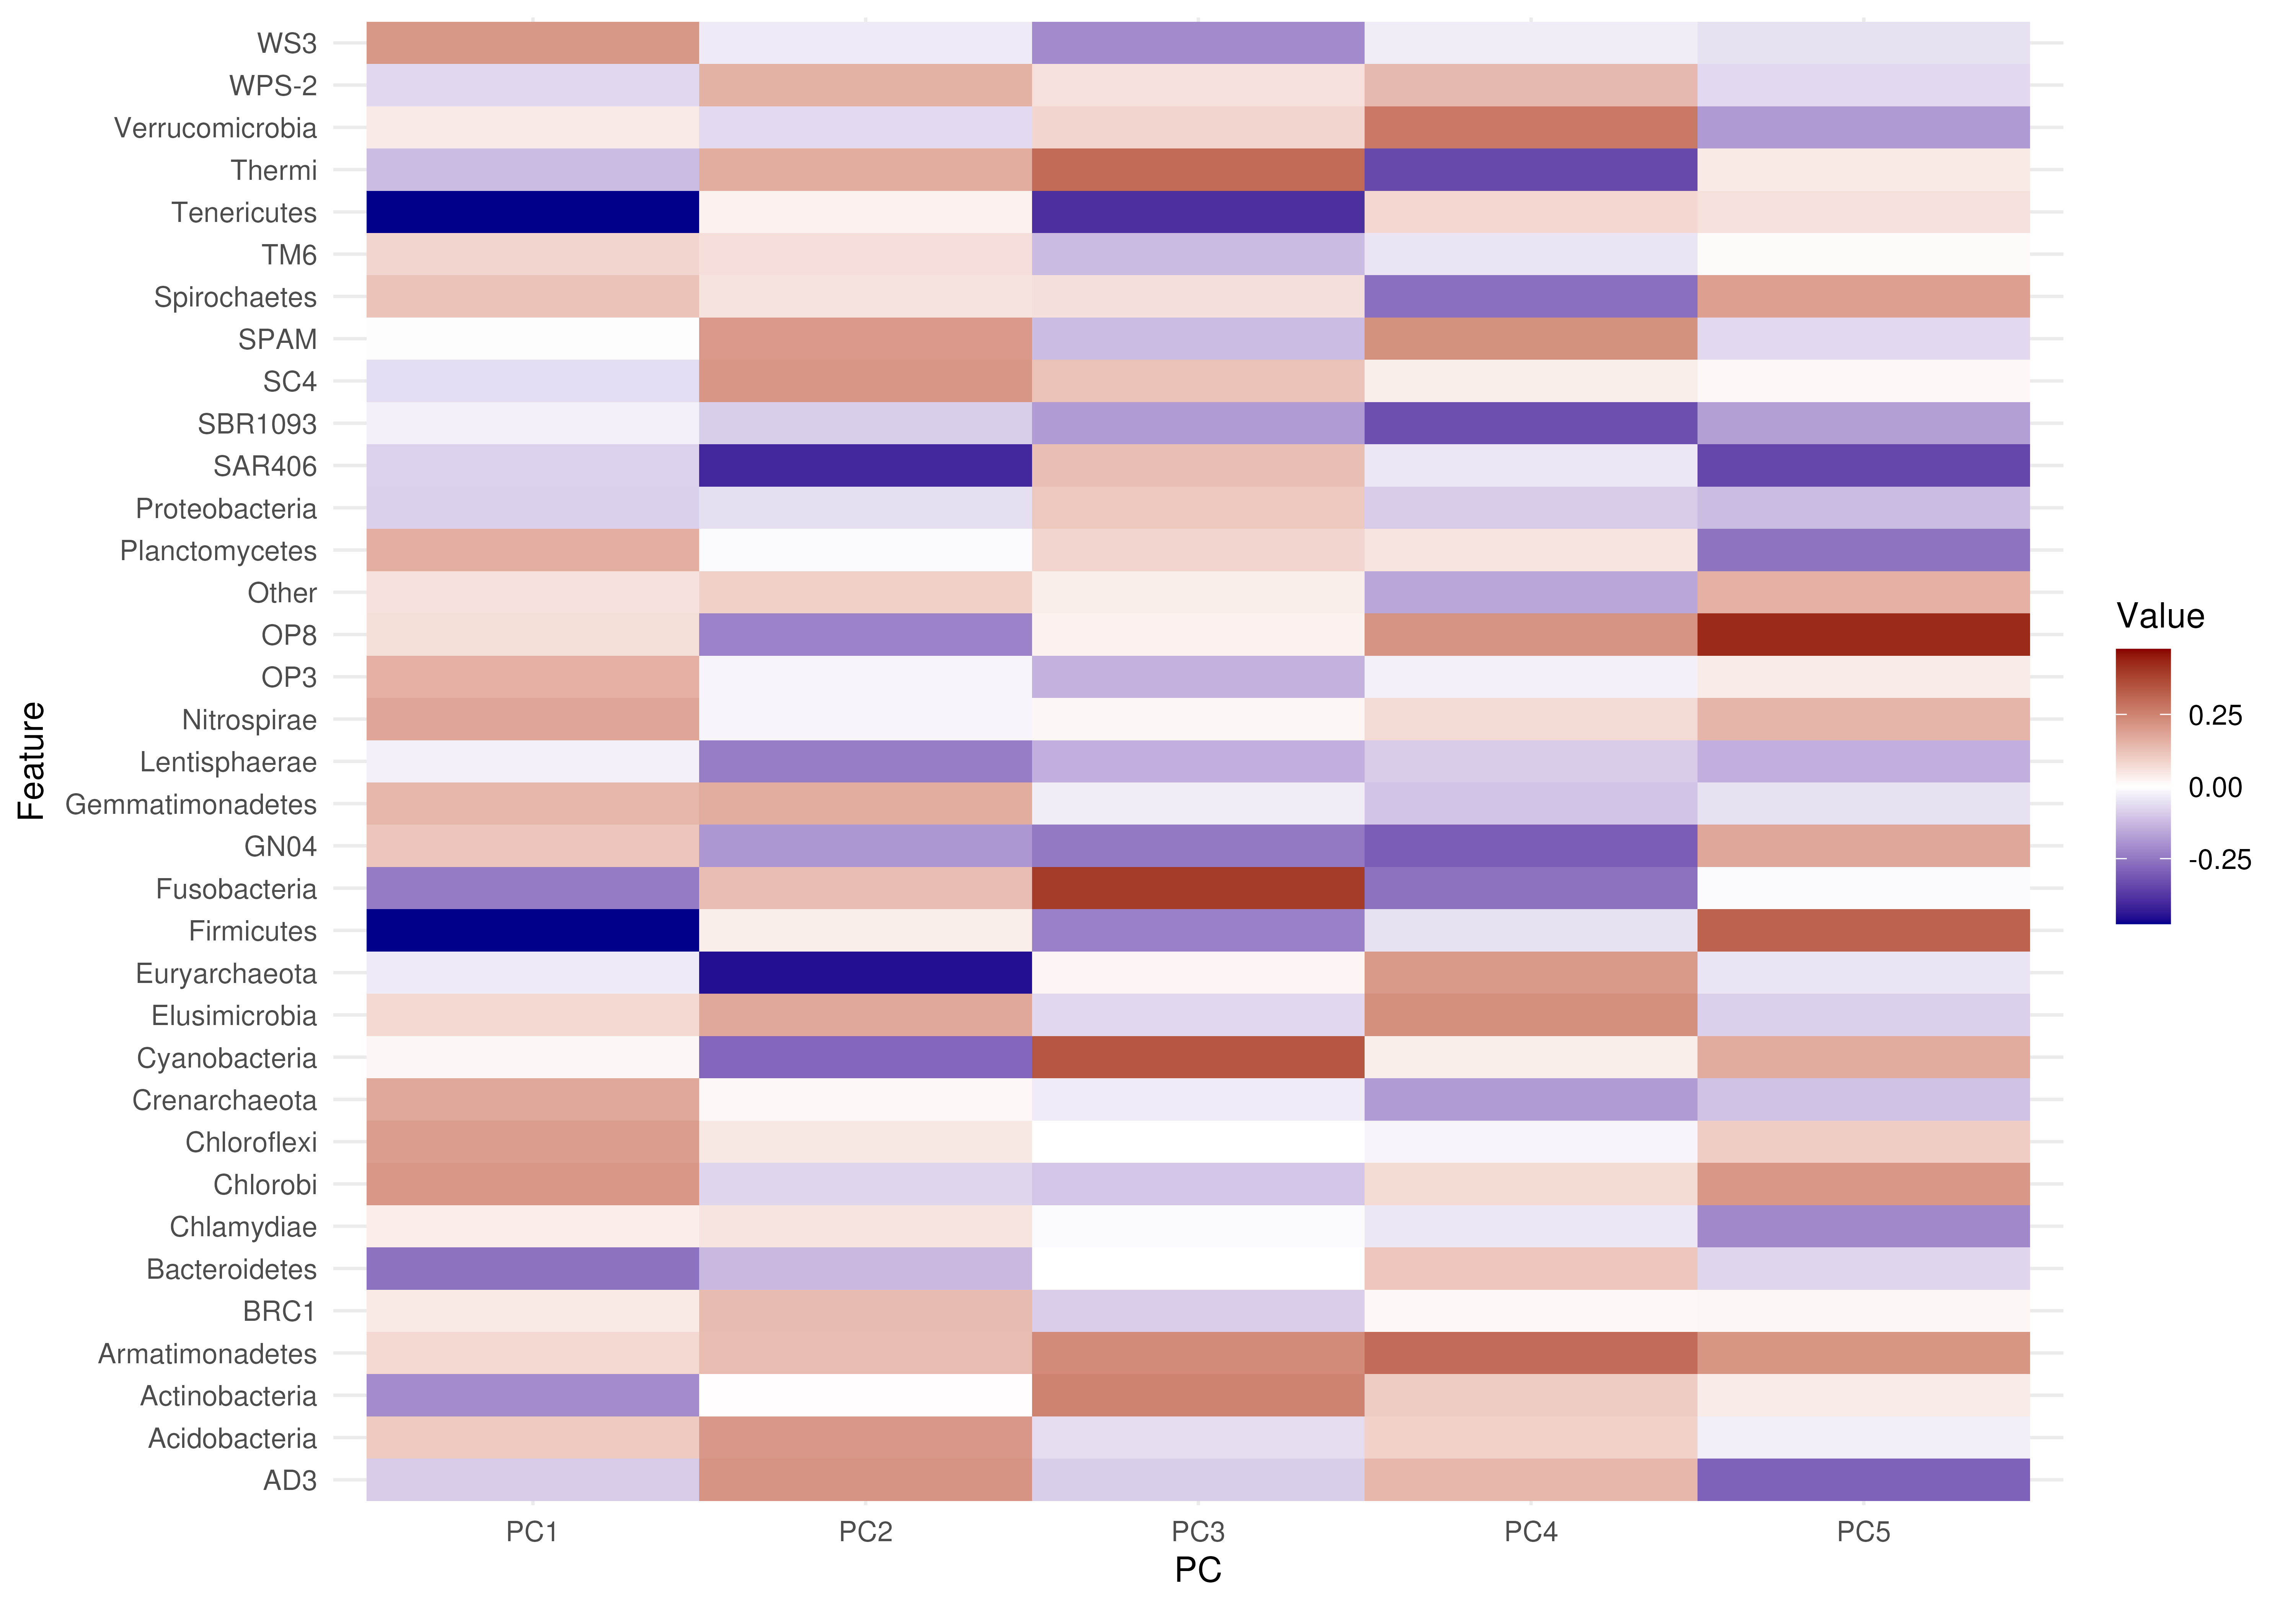
# Plotting feature loadings
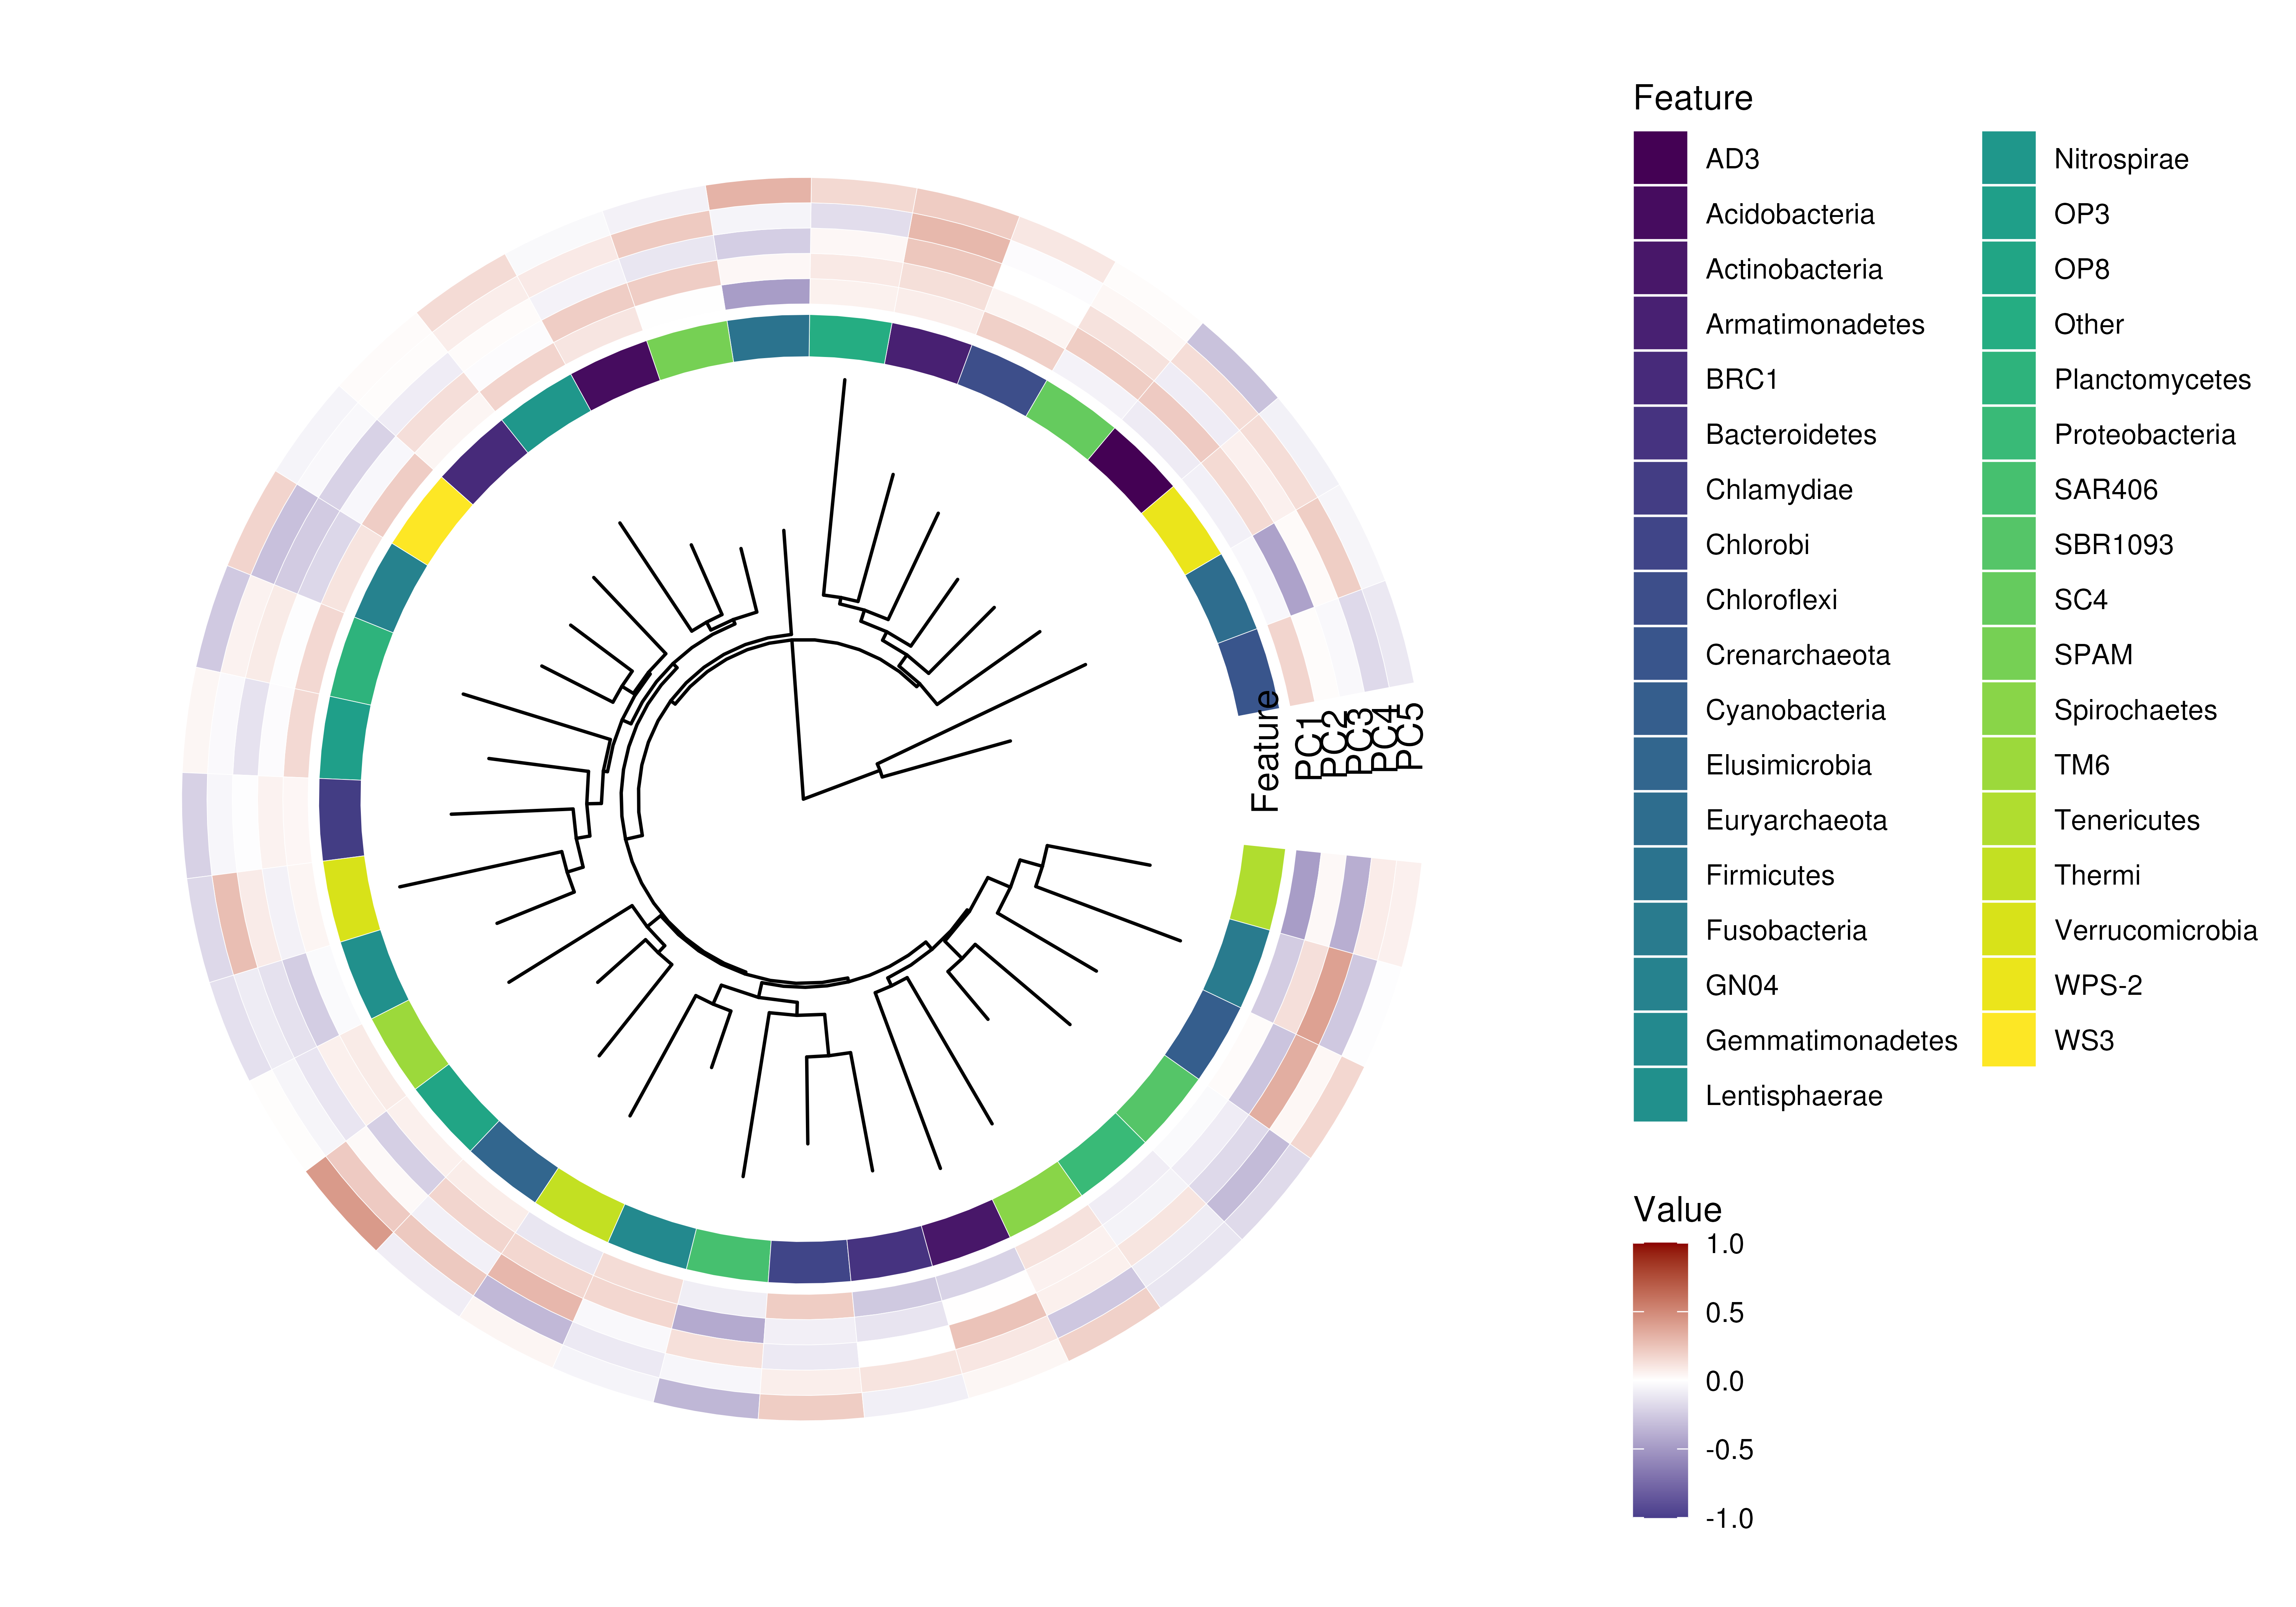
plotLoadings(tse, dimred = "PCA", layout = "heatmap", add.tree = FALSE) |>
# Remove this line to see messages
suppressMessages()
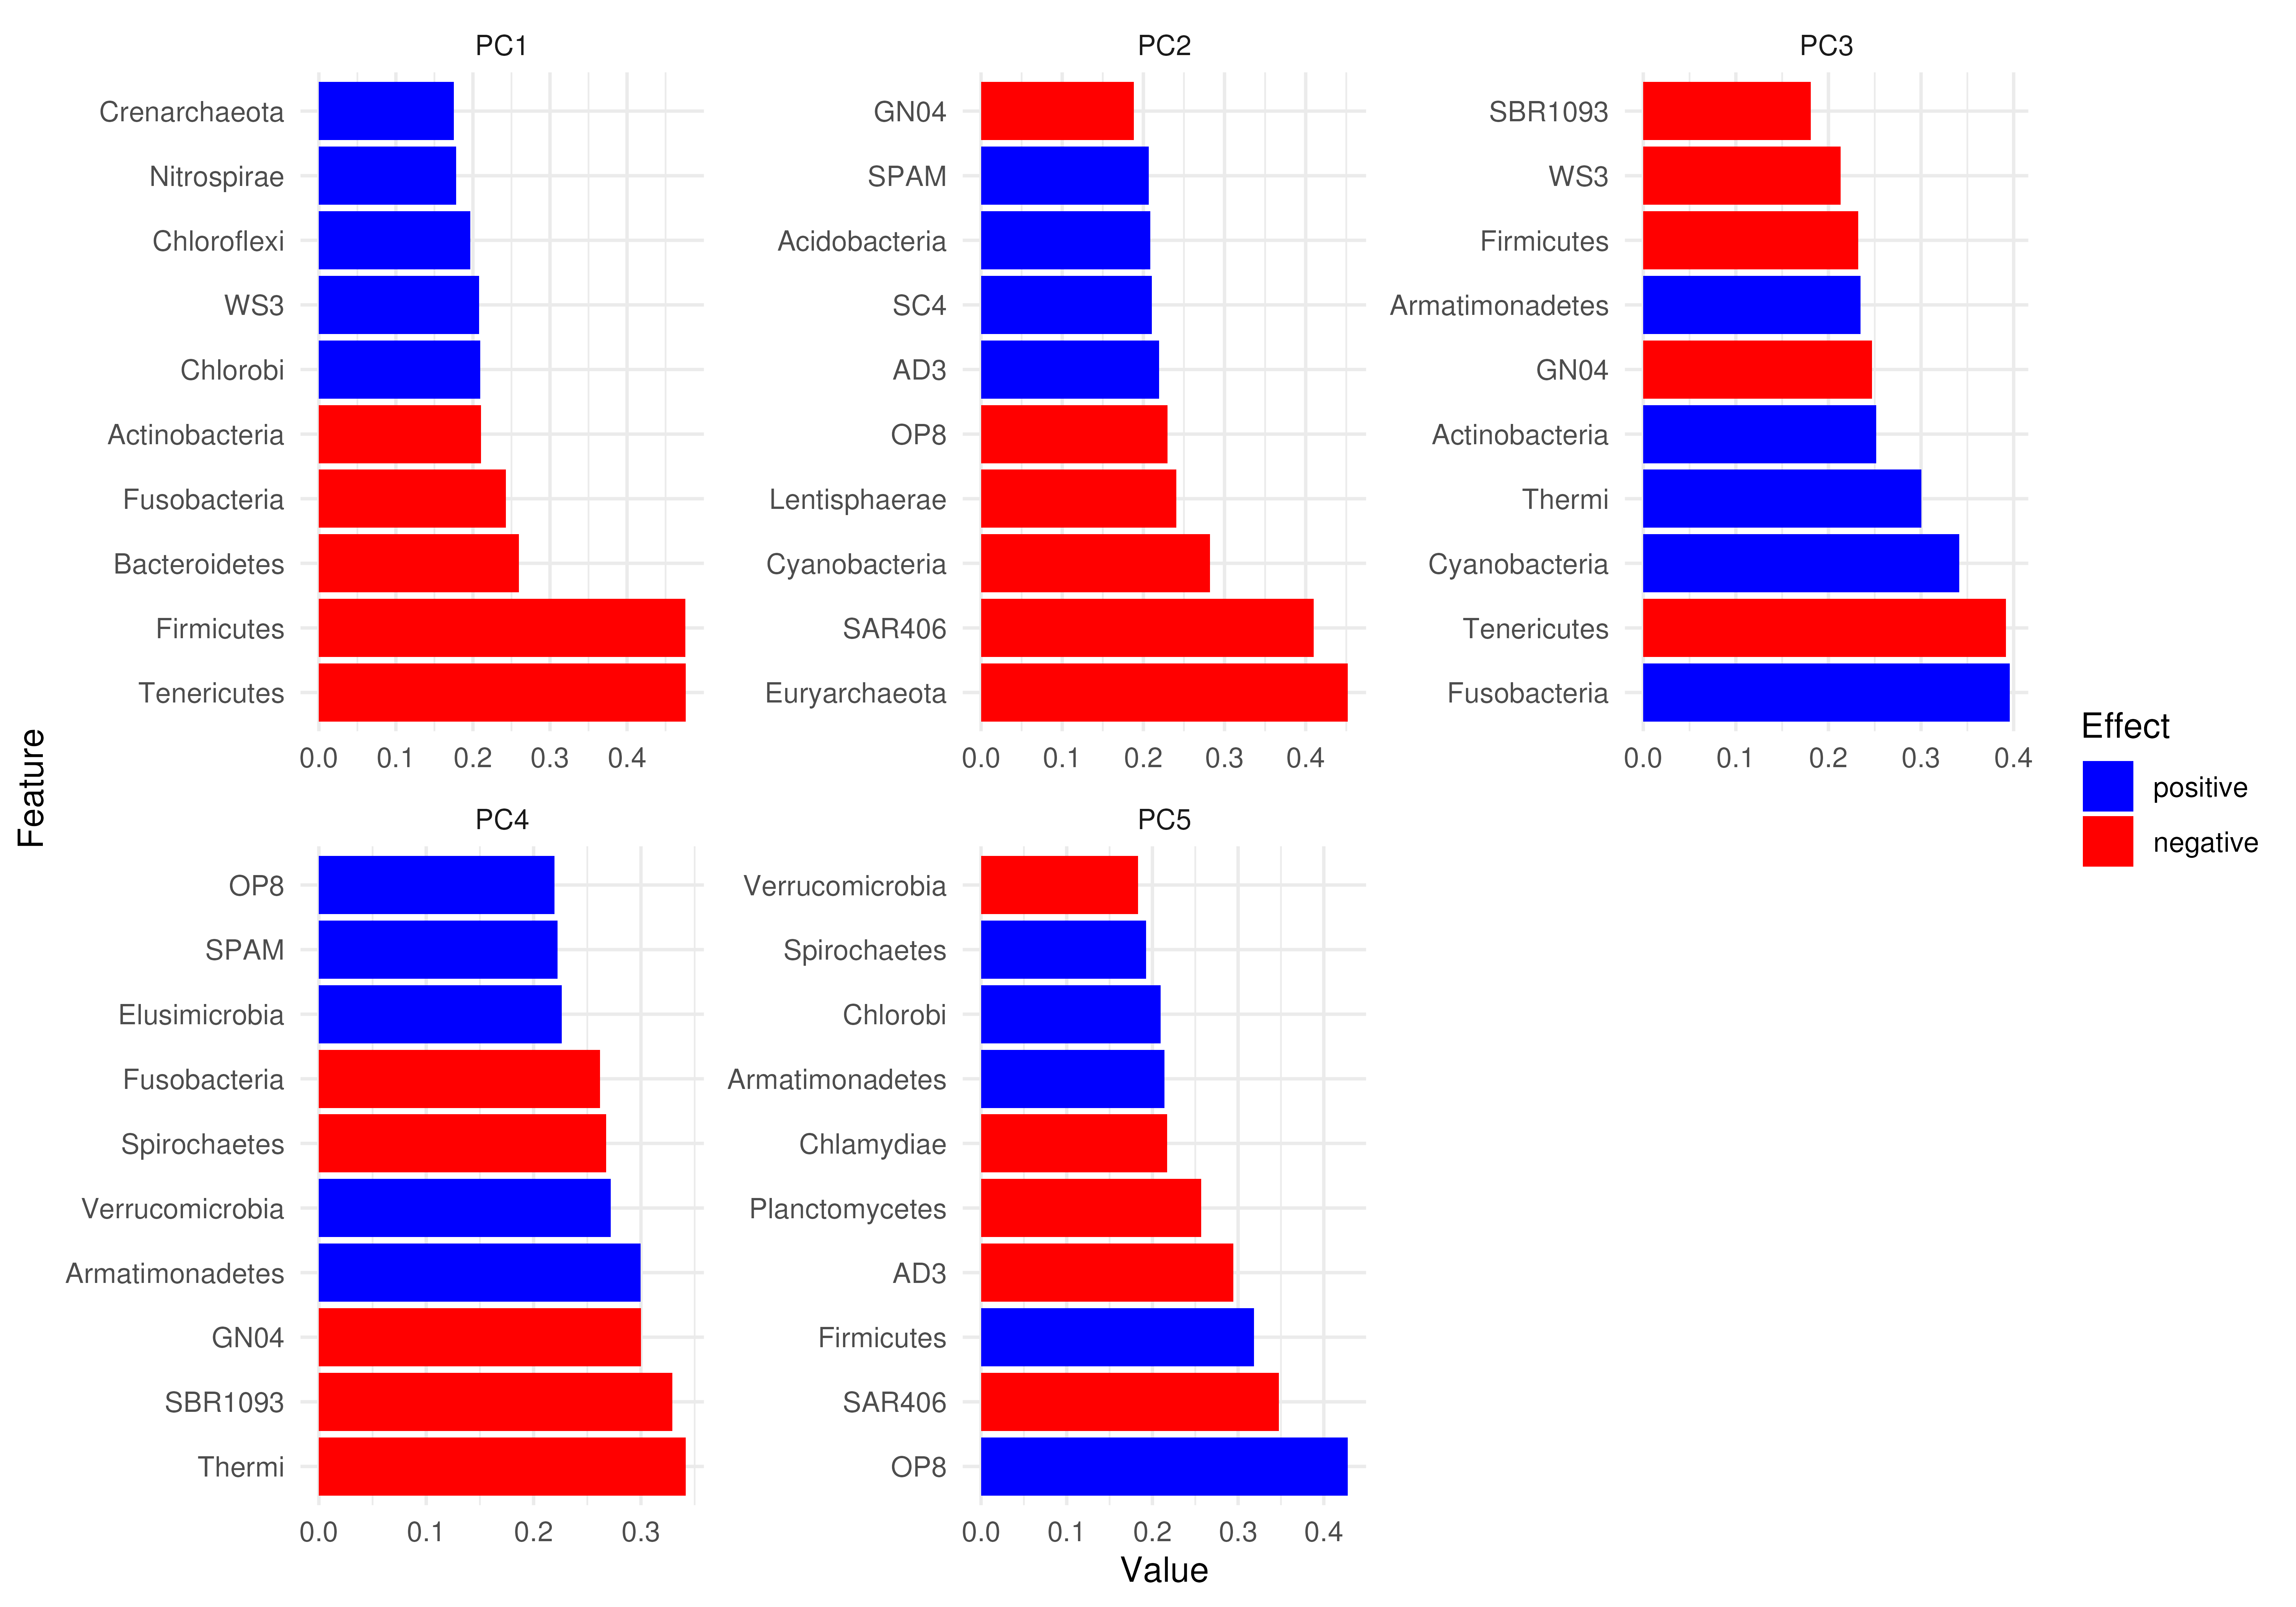
 # Plotting matrix as a barplot
loadings_matrix <- attr(reducedDim(tse, "PCA"), "rotation")
plotLoadings(loadings_matrix)
# Plotting matrix as a barplot
loadings_matrix <- attr(reducedDim(tse, "PCA"), "rotation")
plotLoadings(loadings_matrix)
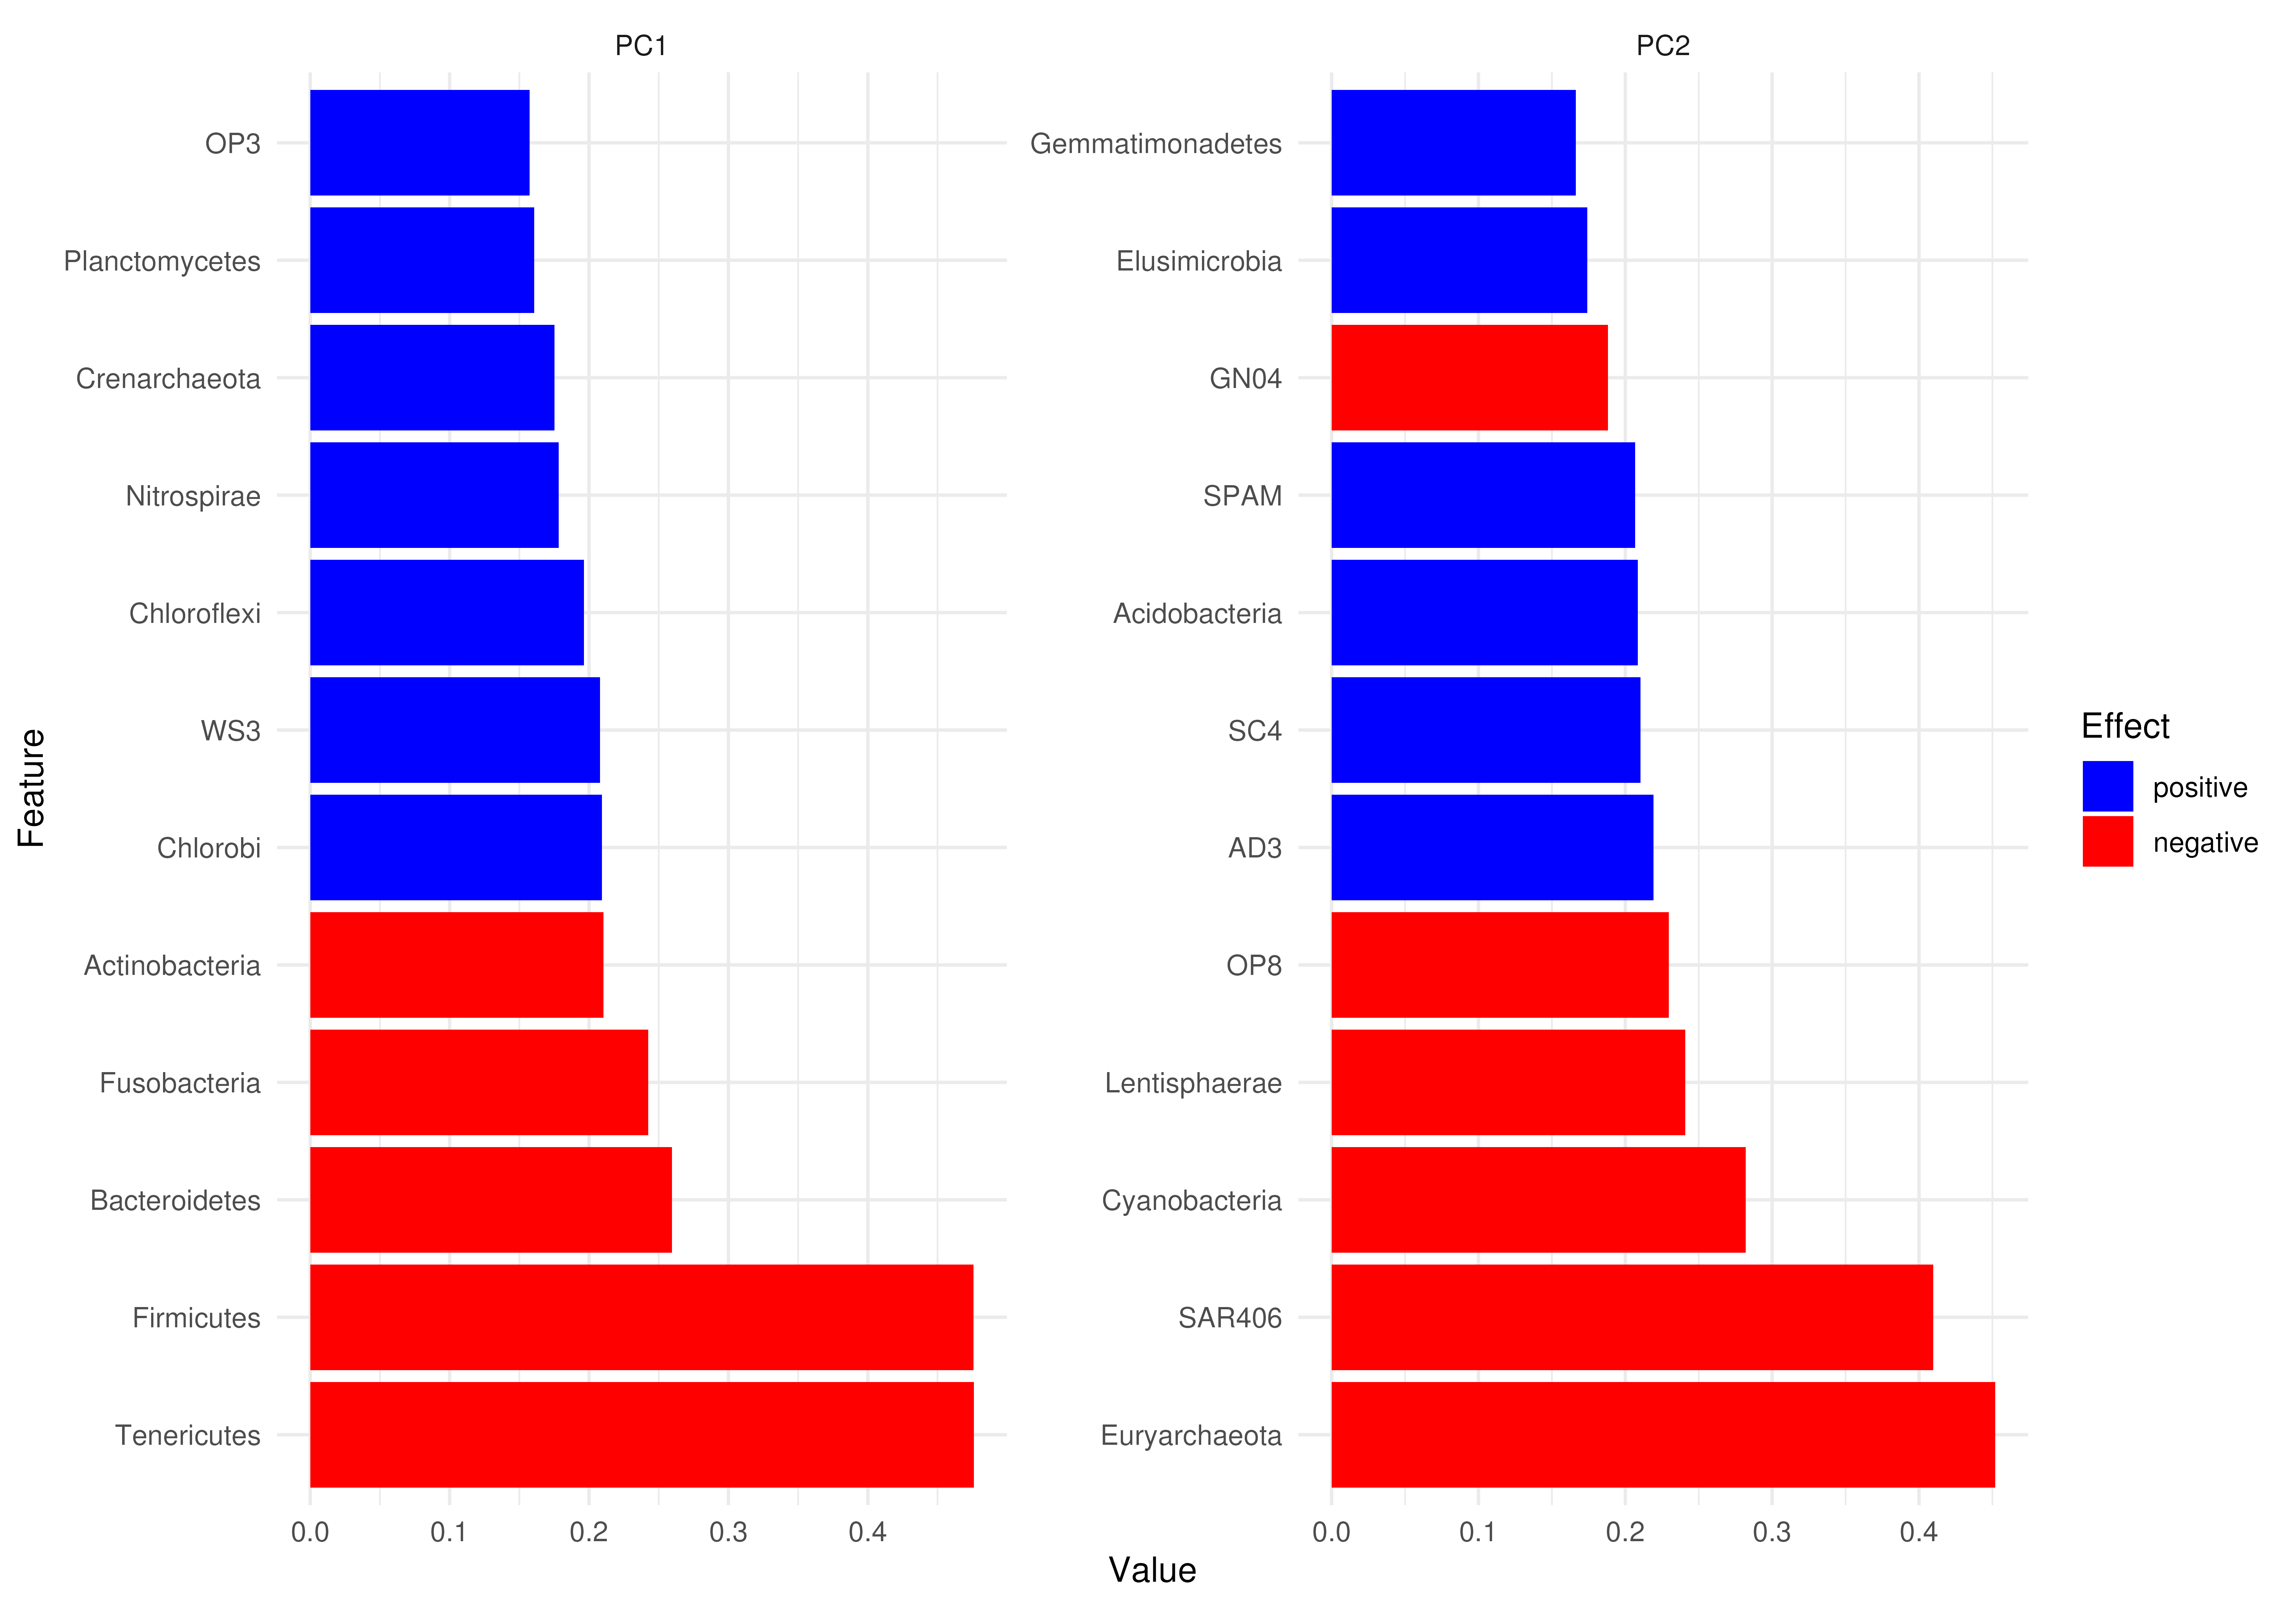
 # Plotting more features but less components
plotLoadings(tse, dimred = "PCA", ncomponents = 2, n = 12)
# Plotting more features but less components
plotLoadings(tse, dimred = "PCA", ncomponents = 2, n = 12)
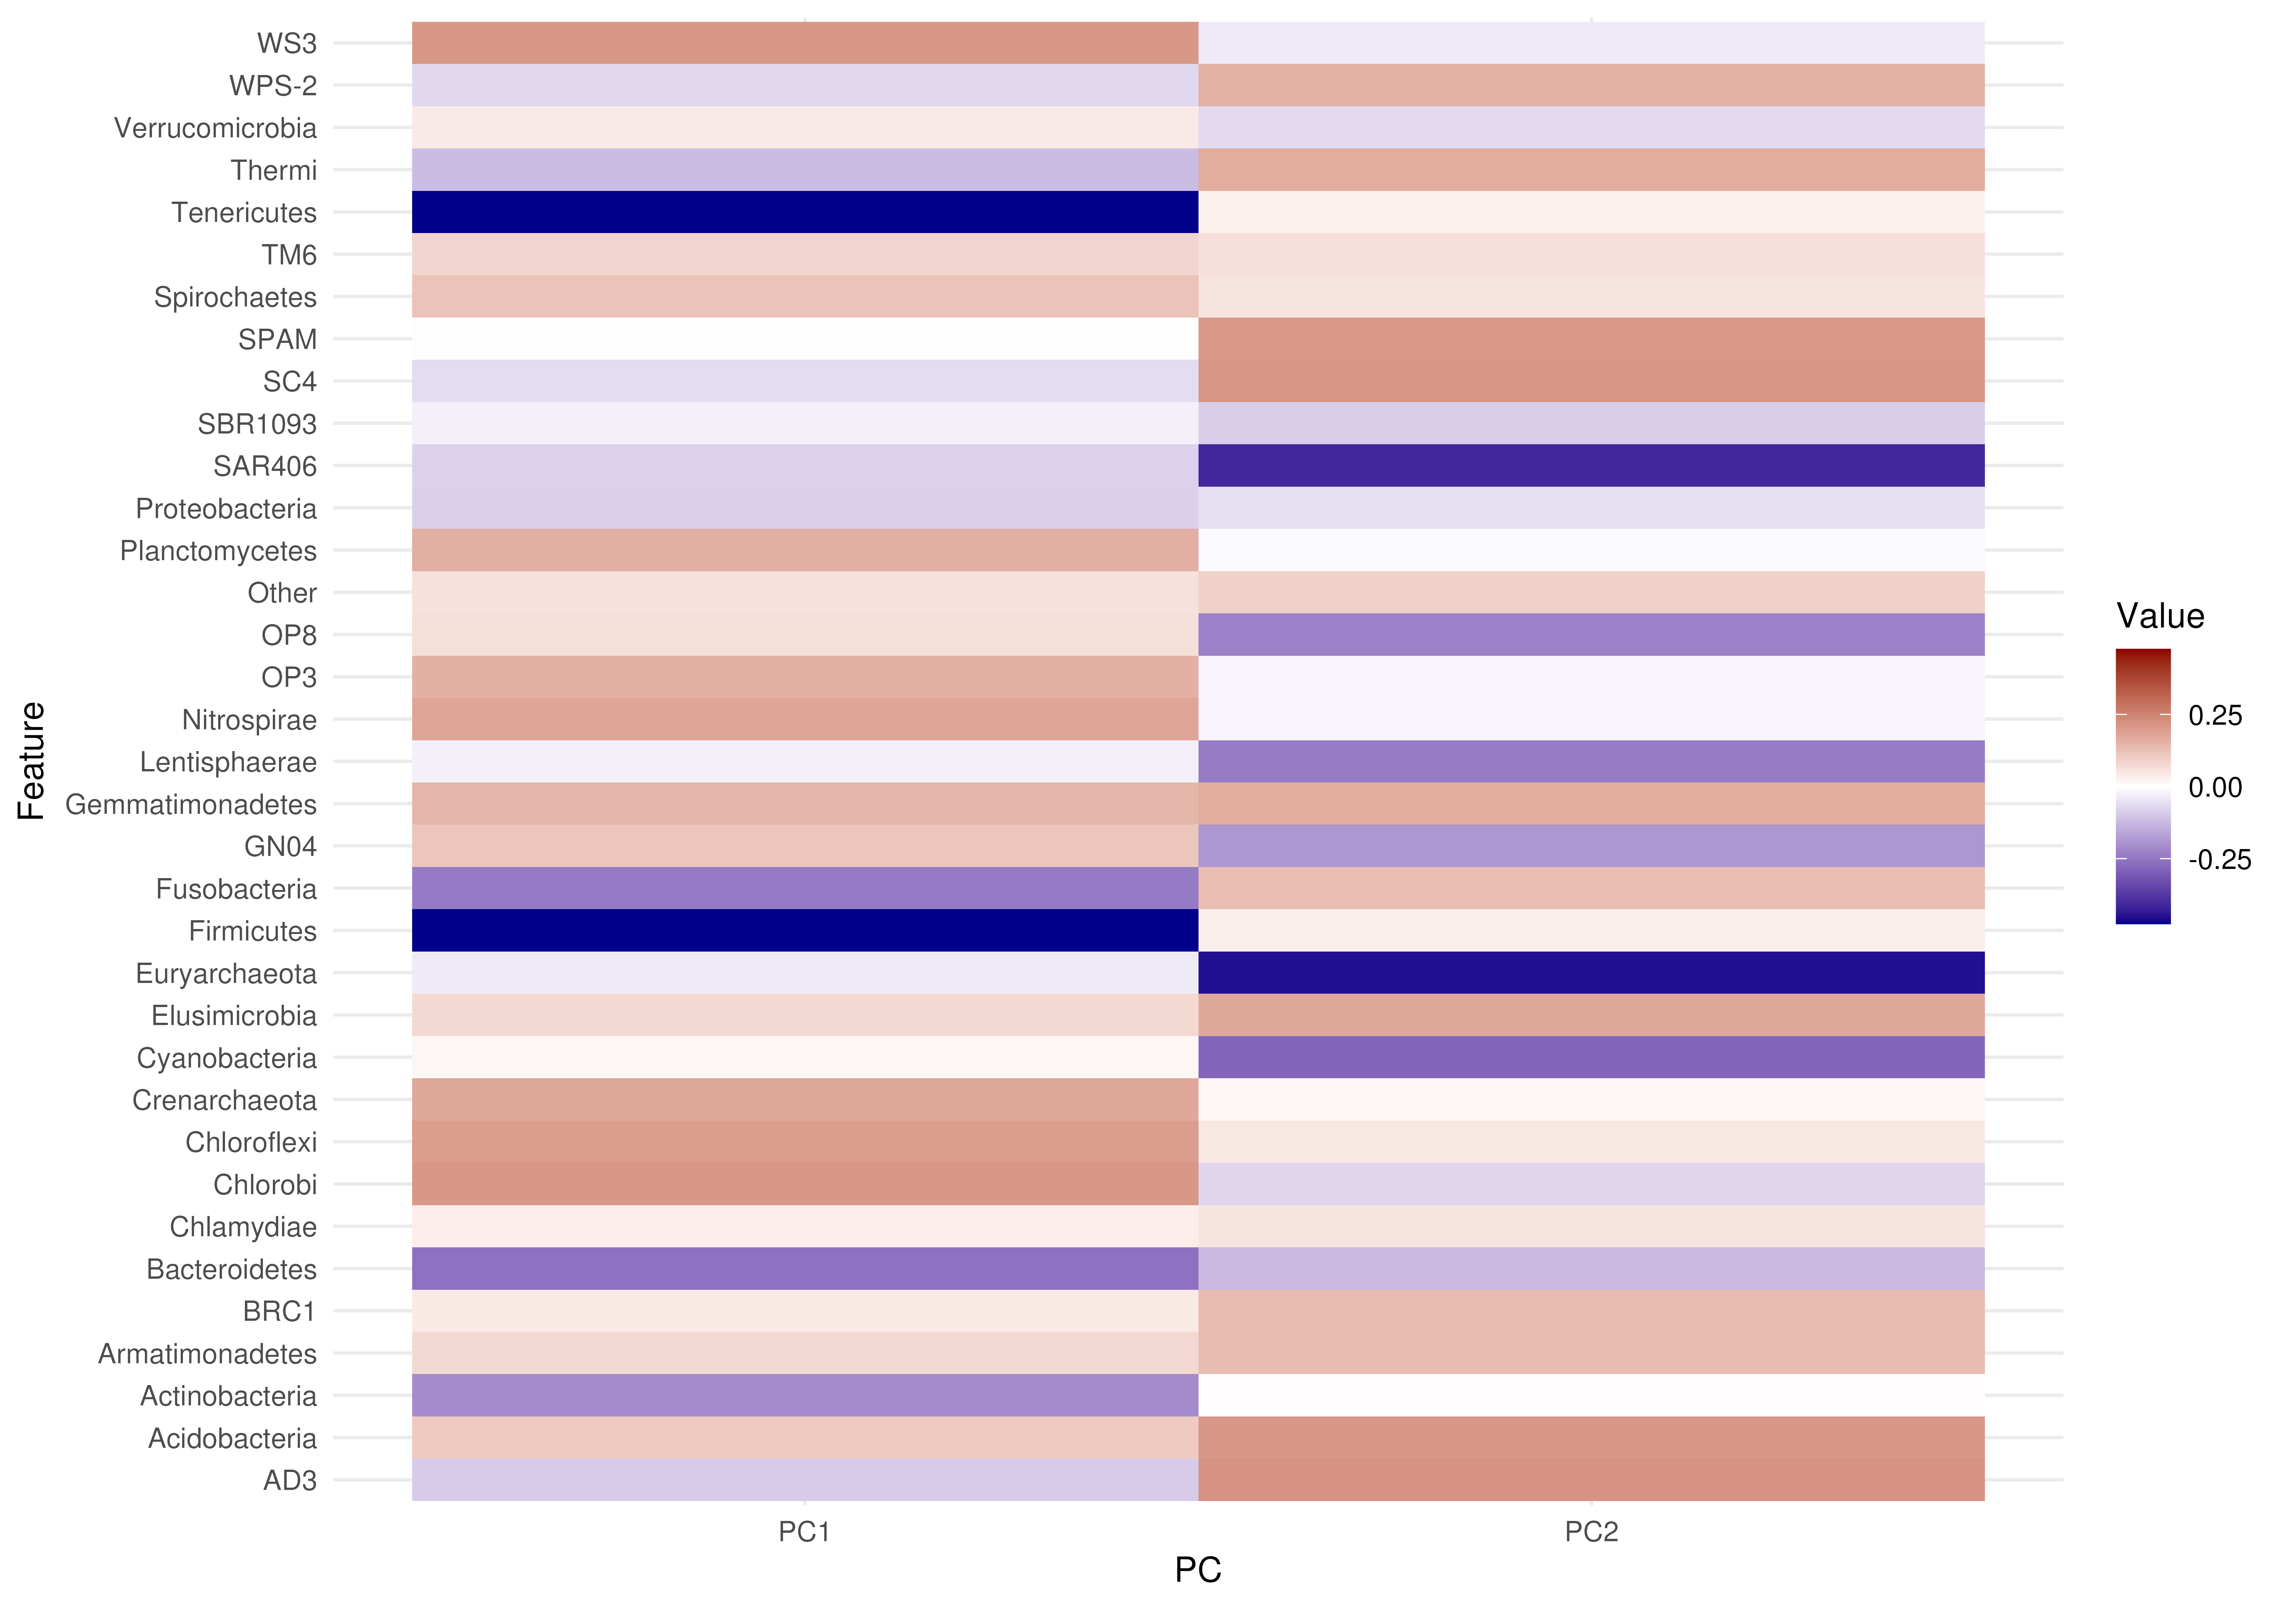
 # Plotting matrix as heatmap without tree
plotLoadings(loadings_matrix, layout = "heatmap")
# Plotting matrix as heatmap without tree
plotLoadings(loadings_matrix, layout = "heatmap")
 # Plot with less components
plotLoadings(tse, "PCA", layout = "heatmap", ncomponents = 2)
# Plot with less components
plotLoadings(tse, "PCA", layout = "heatmap", ncomponents = 2)