plotPrevalence and plotRowPrevalence visualize prevalence
information.
plotRowPrevalence(x, ...)

plotPrevalentAbundance(x, ...)

plotPrevalence(x, ...)

# S4 method for class 'SummarizedExperiment'
plotPrevalence(
  x,
  detection = detections,
  detections = c(0.01, 0.1, 1, 2, 5, 10, 20),
  prevalence = prevalences,
  prevalences = seq(0.1, 1, 0.1),
  assay.type = assay_name,
  assay_name = "counts",
  rank = NULL,
  BPPARAM = BiocParallel::SerialParam(),
  ...
)

# S4 method for class 'SummarizedExperiment'
plotPrevalentAbundance(
  x,
  rank = NULL,
  assay.type = assay_name,
  assay_name = "counts",
  colour.by = colour_by,
  colour_by = NULL,
  size.by = size_by,
  size_by = NULL,
  shape.by = shape_by,
  shape_by = NULL,
  show.label = label,
  label = NULL,
  facet.by = facet_by,
  facet_by = NULL,
  ...
)

# S4 method for class 'SummarizedExperiment'
plotRowPrevalence(
  x,
  rank = NULL,
  assay.type = assay_name,
  assay_name = "counts",
  detection = detections,
  detections = c(0.01, 0.1, 1, 2, 5, 10, 20),
  min.prevalence = min_prevalence,
  min_prevalence = 0,
  BPPARAM = BiocParallel::SerialParam(),
  ...
)
Arguments
- x
a
SummarizedExperimentobject.- detection
Numeric scalar. Detection thresholds for absence/presence. Either an absolutes value compared directly to the values ofxor a relative value between 0 and 1, ifTRUE.- detections
Deprecated. Use
detectioninstead.- prevalence
Numeric scalar. Prevalence thresholds (in 0 to 1). The required prevalence is strictly greater by default. To include the limit, setinclude.lowesttoTRUE.- prevalences
Deprecated. Use
prevalenceinstead.- assay.type
Character scalar. Defines which assay data to use. (Default:"relabundance")- assay_name
Deprecated. Use
assay.typeinstead.- rank, ...
additional arguments
as.relative
Logical scalar. Should the relative values be calculated? (Default:FALSE)ndetection
Integer scalar. Determines the number of breaks calculated detection thresholds whendetection=NULL. WhenTRUE,as_relativeis then also regarded asTRUE. (Default:20)If
!is.null(rank)matching arguments are passed on toagglomerateByRank. See?agglomerateByRankfor more details.additional arguments for plotting. See
mia-plot-argsfor more details i.e. callhelp("mia-plot-args")
- BPPARAM
A
BiocParallelParamobject specifying whether the UniFrac calculation should be parallelized.- colour.by
Character scalar. Specification of a feature to colour points by, see thebyargument in?retrieveFeatureInfofor possible values. Only used withlayout = "point". (Default:NULL)- colour_by
Deprecated. Use
colour.byinstead.- size.by
Character scalar. Specification of a feature to size points by, see thebyargument in?retrieveFeatureInfofor possible values. Only used withlayout = "point". (Default:NULL)- size_by
Deprecated. Use
size.byinstead.- shape.by
Character scalar. Specification of a feature to shape points by, see thebyargument in?retrieveFeatureInfofor possible values. Only used withlayout = "point". (Default:NULL)- shape_by
Deprecated. Use
shape.byinstead.- show.label
Logical scalar,character scalarorinteger vectorfor selecting labels from the rownames ofx. Ifrankis notNULLthe rownames might change. (Default:NULL)- label
Deprecated. Use
show.labelinstead.- facet.by
Character scalar. Taxonomic rank to facet the plot by. Value must be oftaxonomyRanks(x)Argument can only be used in function plotPrevalentAbundance.- facet_by
Deprecated. Use
facet.byinstead.- min.prevalence
Numeric scalar. Applied as a threshold for plotting. The threshold is applied per row and column. (Default:0)- min_prevalence
Deprecated. Use
min.prevalenceinstead.
Value
A ggplot2 object or plotly object, if more than one
prevalence was defined.
Details
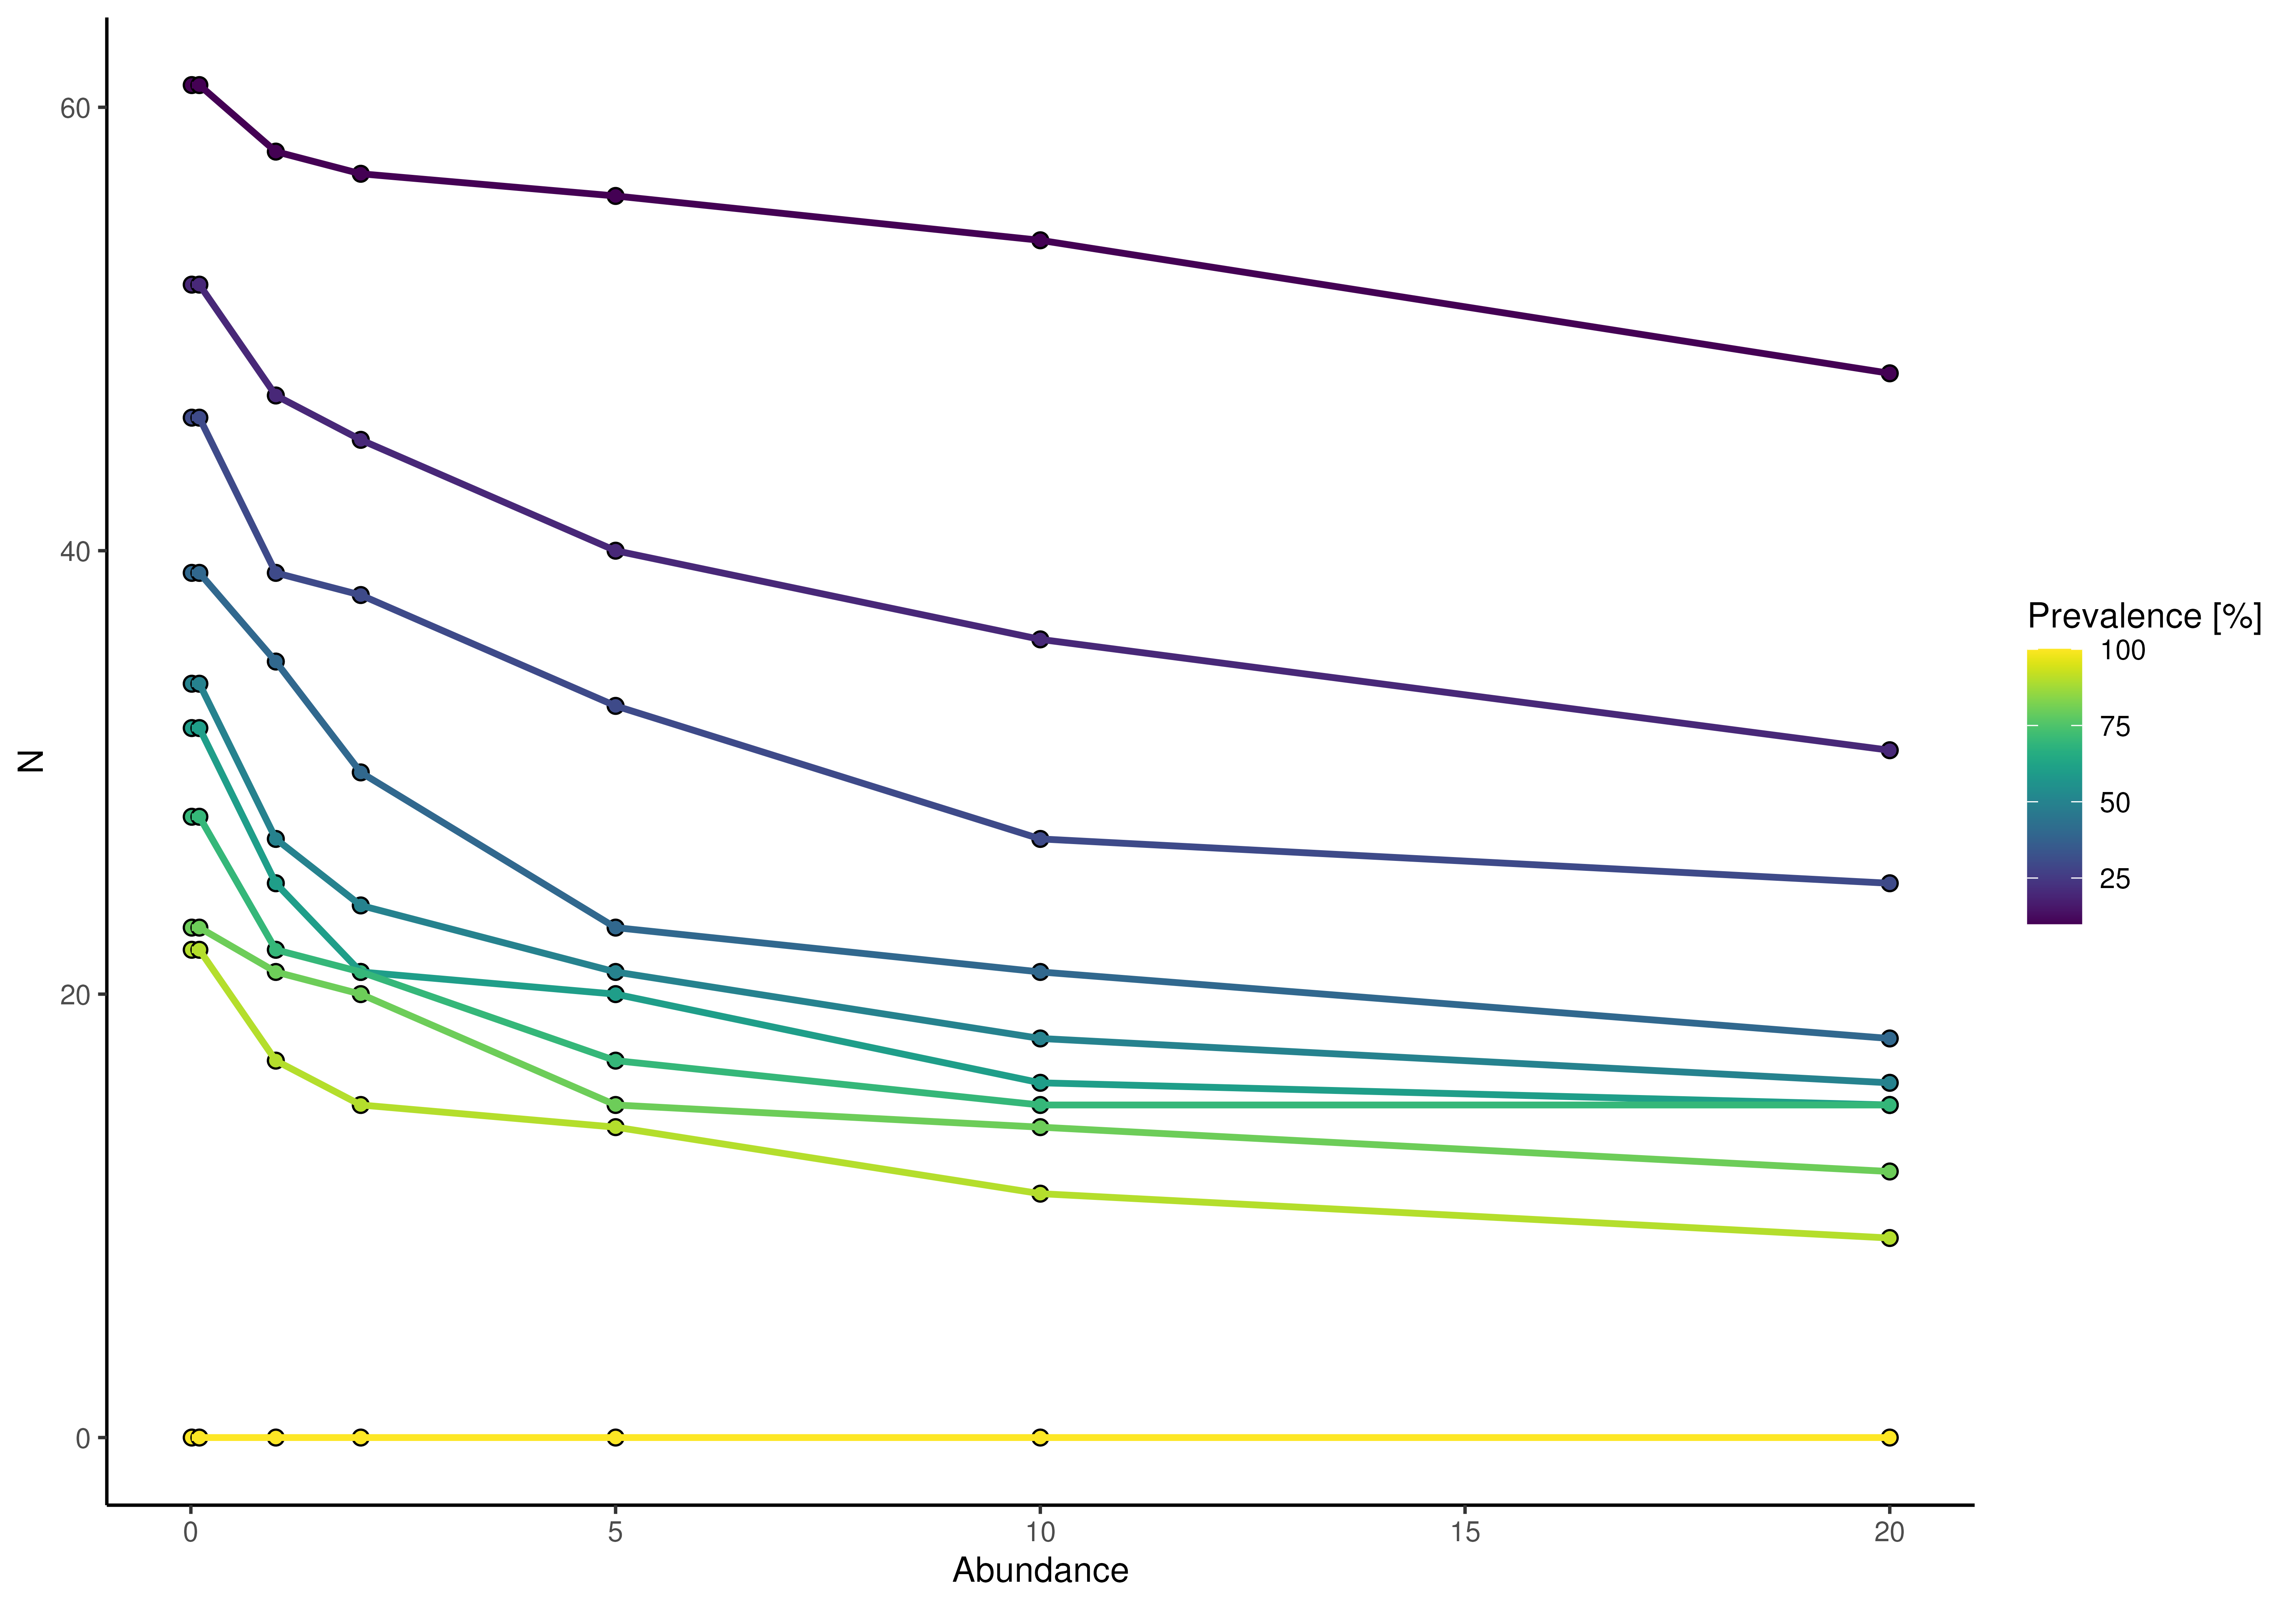
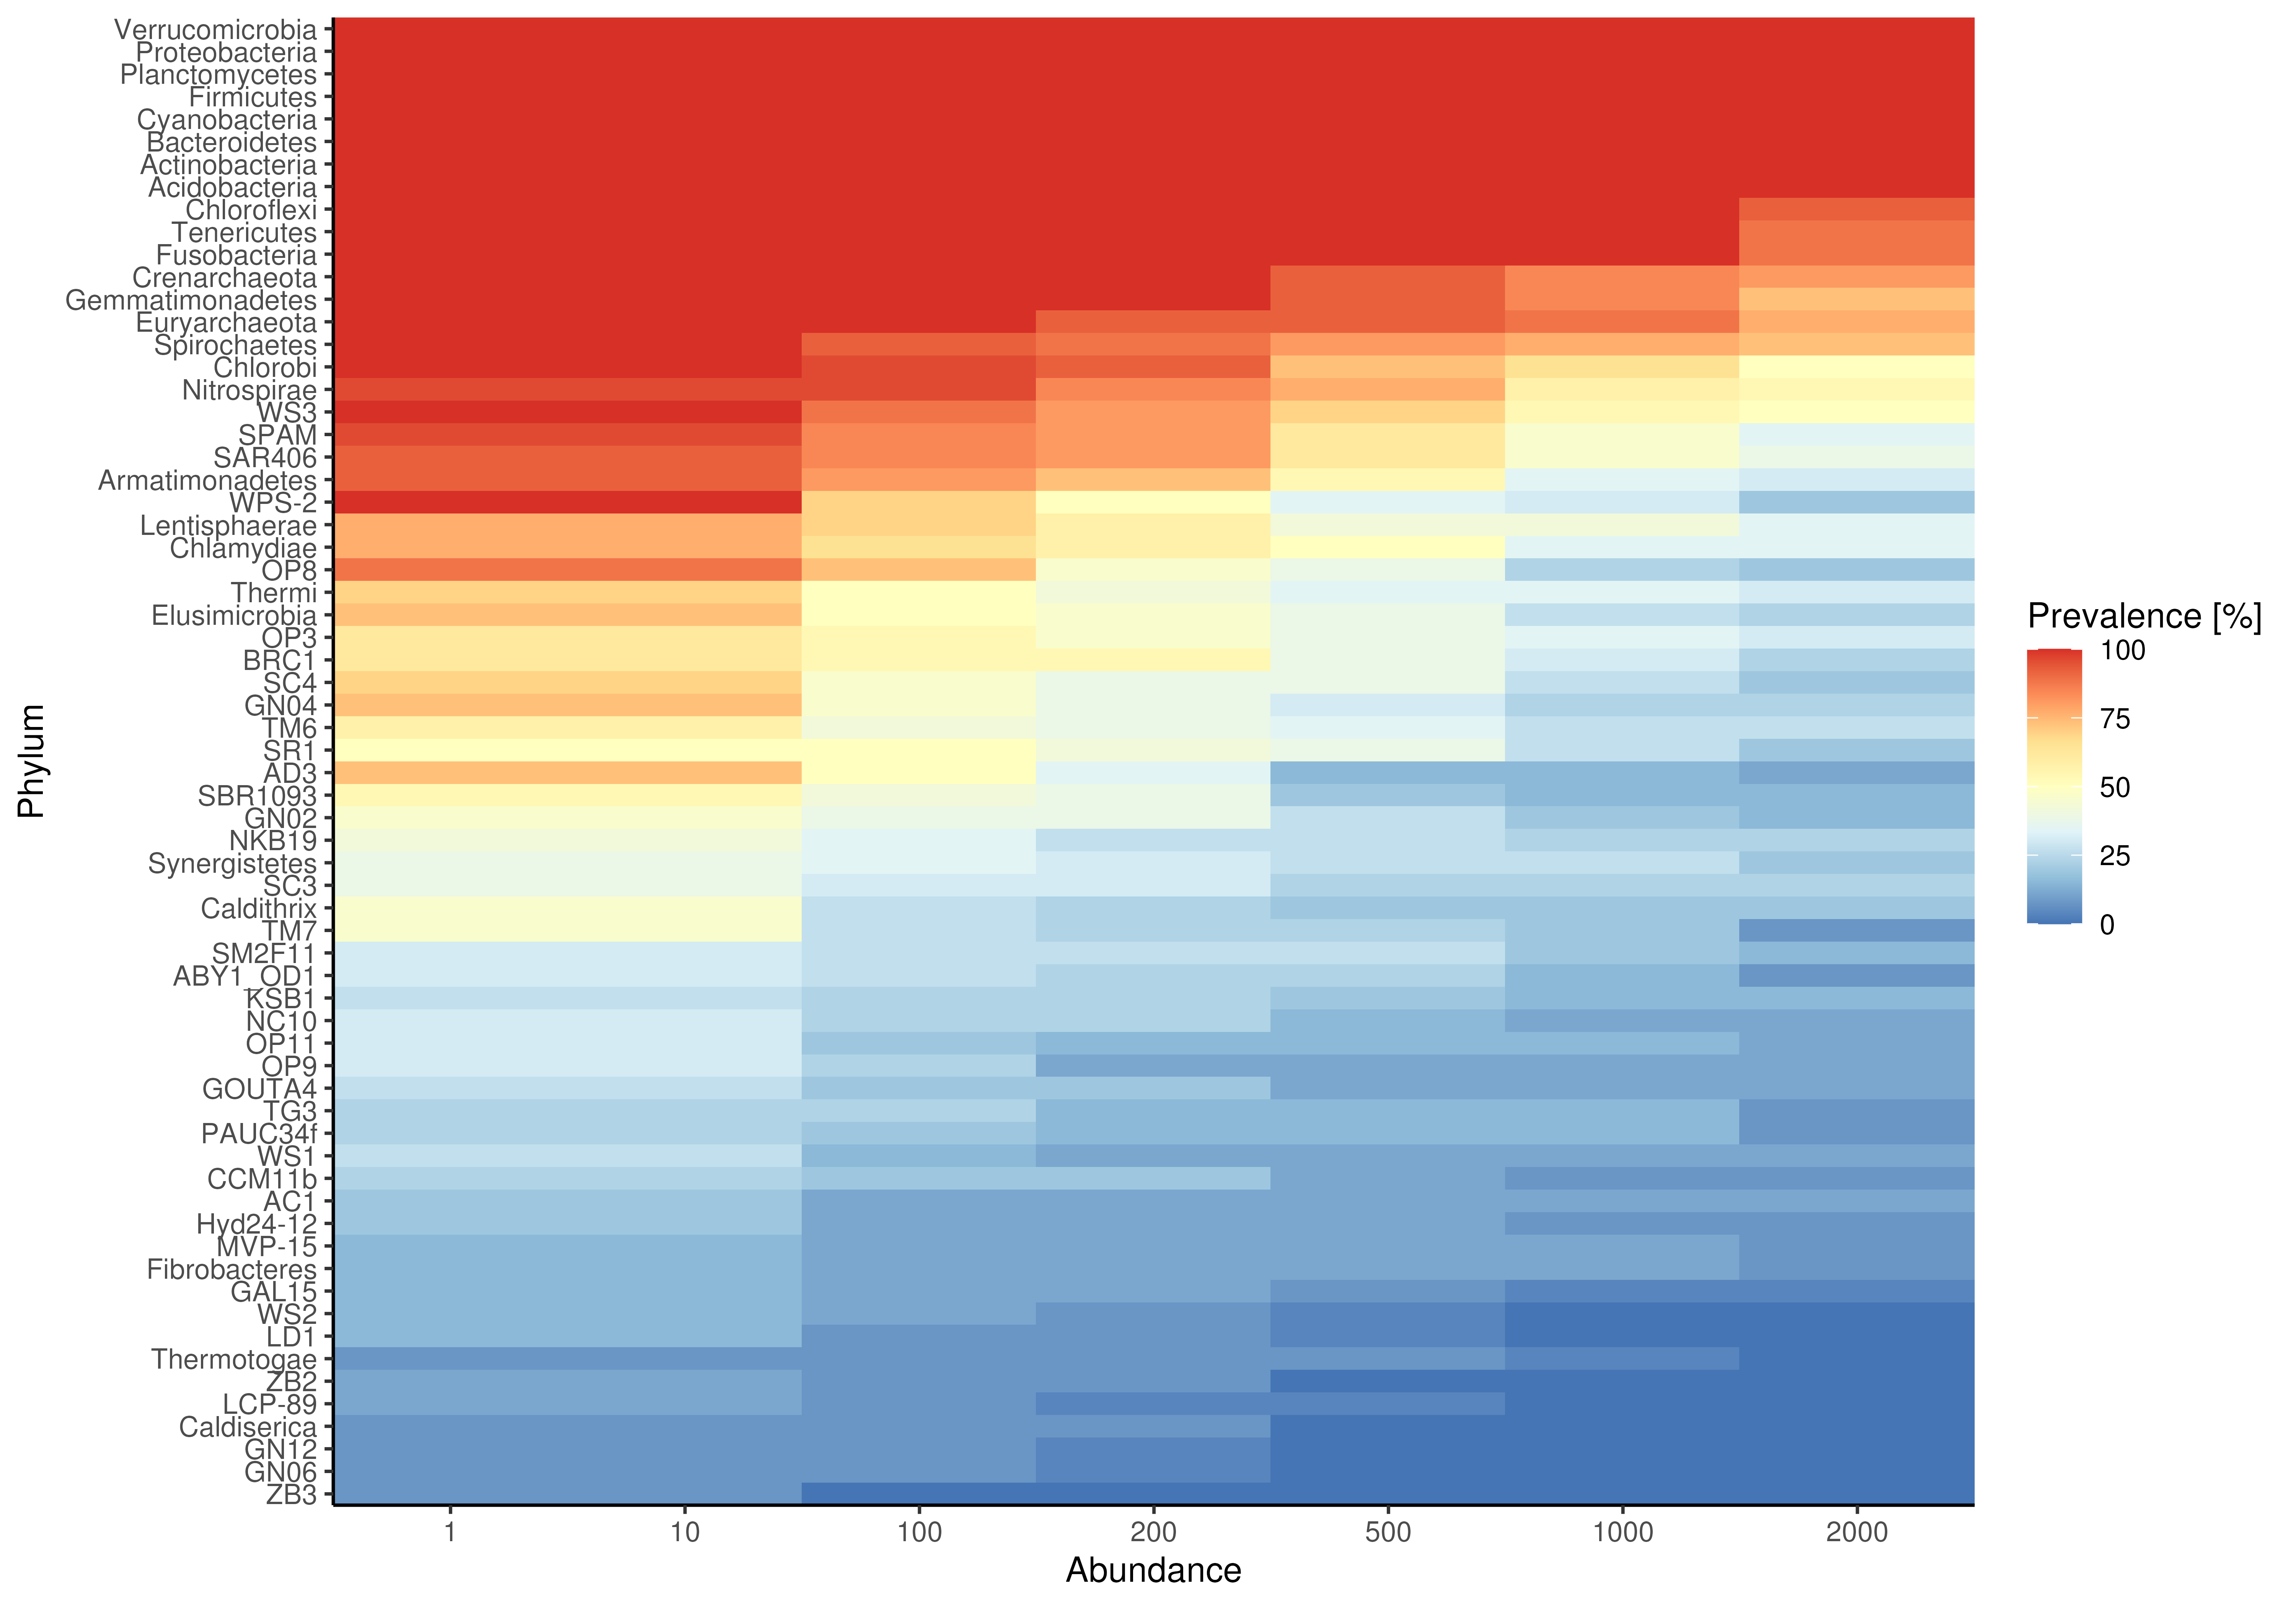
Whereas plotPrevalence produces a line plot, plotRowPrevalence
returns a heatmap.
Agglomeration on different taxonomic levels is available through the
rank argument.
To exclude certain taxa, preprocess x to your liking, for example
with subsetting via getPrevalent or
agglomerateByPrevalence.
Examples
data(GlobalPatterns, package = "mia")
# Apply relative transformation
GlobalPatterns <- transformAssay(GlobalPatterns, method = "relabundance")
# plotting N of prevalence exceeding taxa on the Phylum level
plotPrevalence(GlobalPatterns, rank = "Phylum")
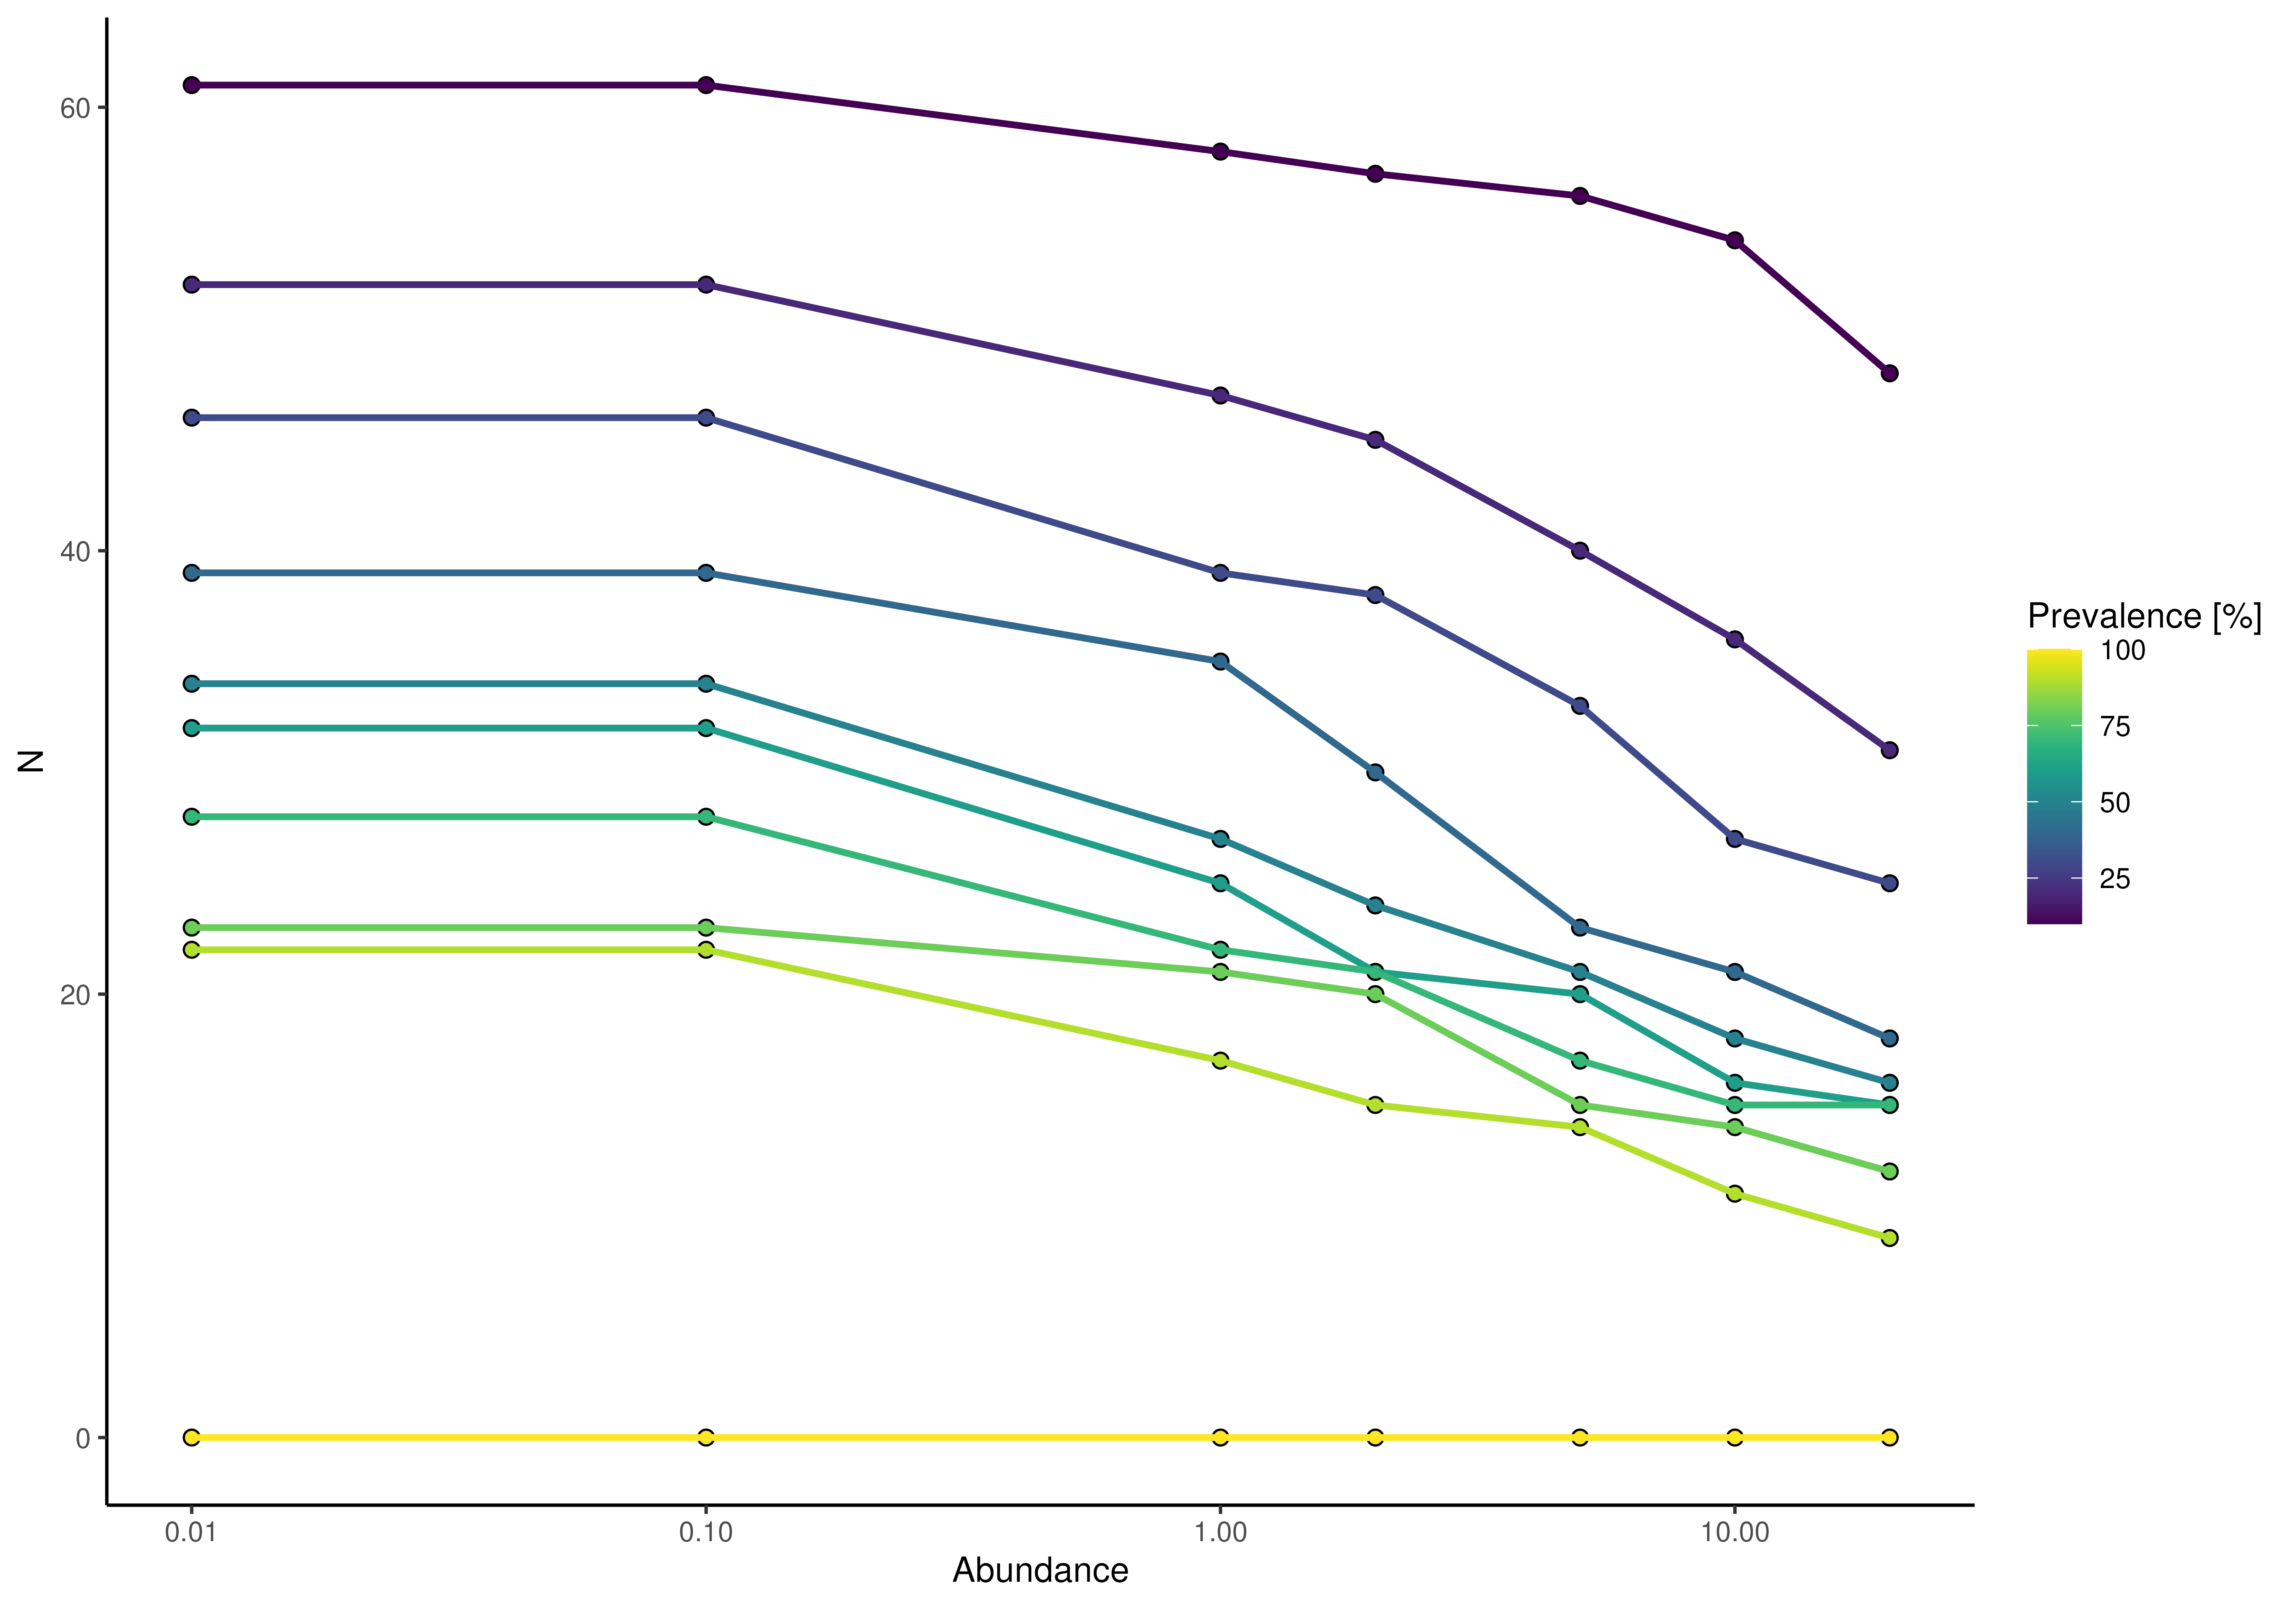
 plotPrevalence(GlobalPatterns, rank = "Phylum") + scale_x_log10()
 # plotting prevalence per taxa for different detection thresholds as heatmap
plotRowPrevalence(GlobalPatterns, rank = "Phylum")
# plotting prevalence per taxa for different detection thresholds as heatmap
plotRowPrevalence(GlobalPatterns, rank = "Phylum")
 # by default a continuous scale is used for different detection levels,
# but this can be adjusted
plotRowPrevalence(
GlobalPatterns, rank = "Phylum", assay.type = "relabundance",
detection = c(0, 0.001, 0.01, 0.1, 0.2))
# by default a continuous scale is used for different detection levels,
# but this can be adjusted
plotRowPrevalence(
GlobalPatterns, rank = "Phylum", assay.type = "relabundance",
detection = c(0, 0.001, 0.01, 0.1, 0.2))
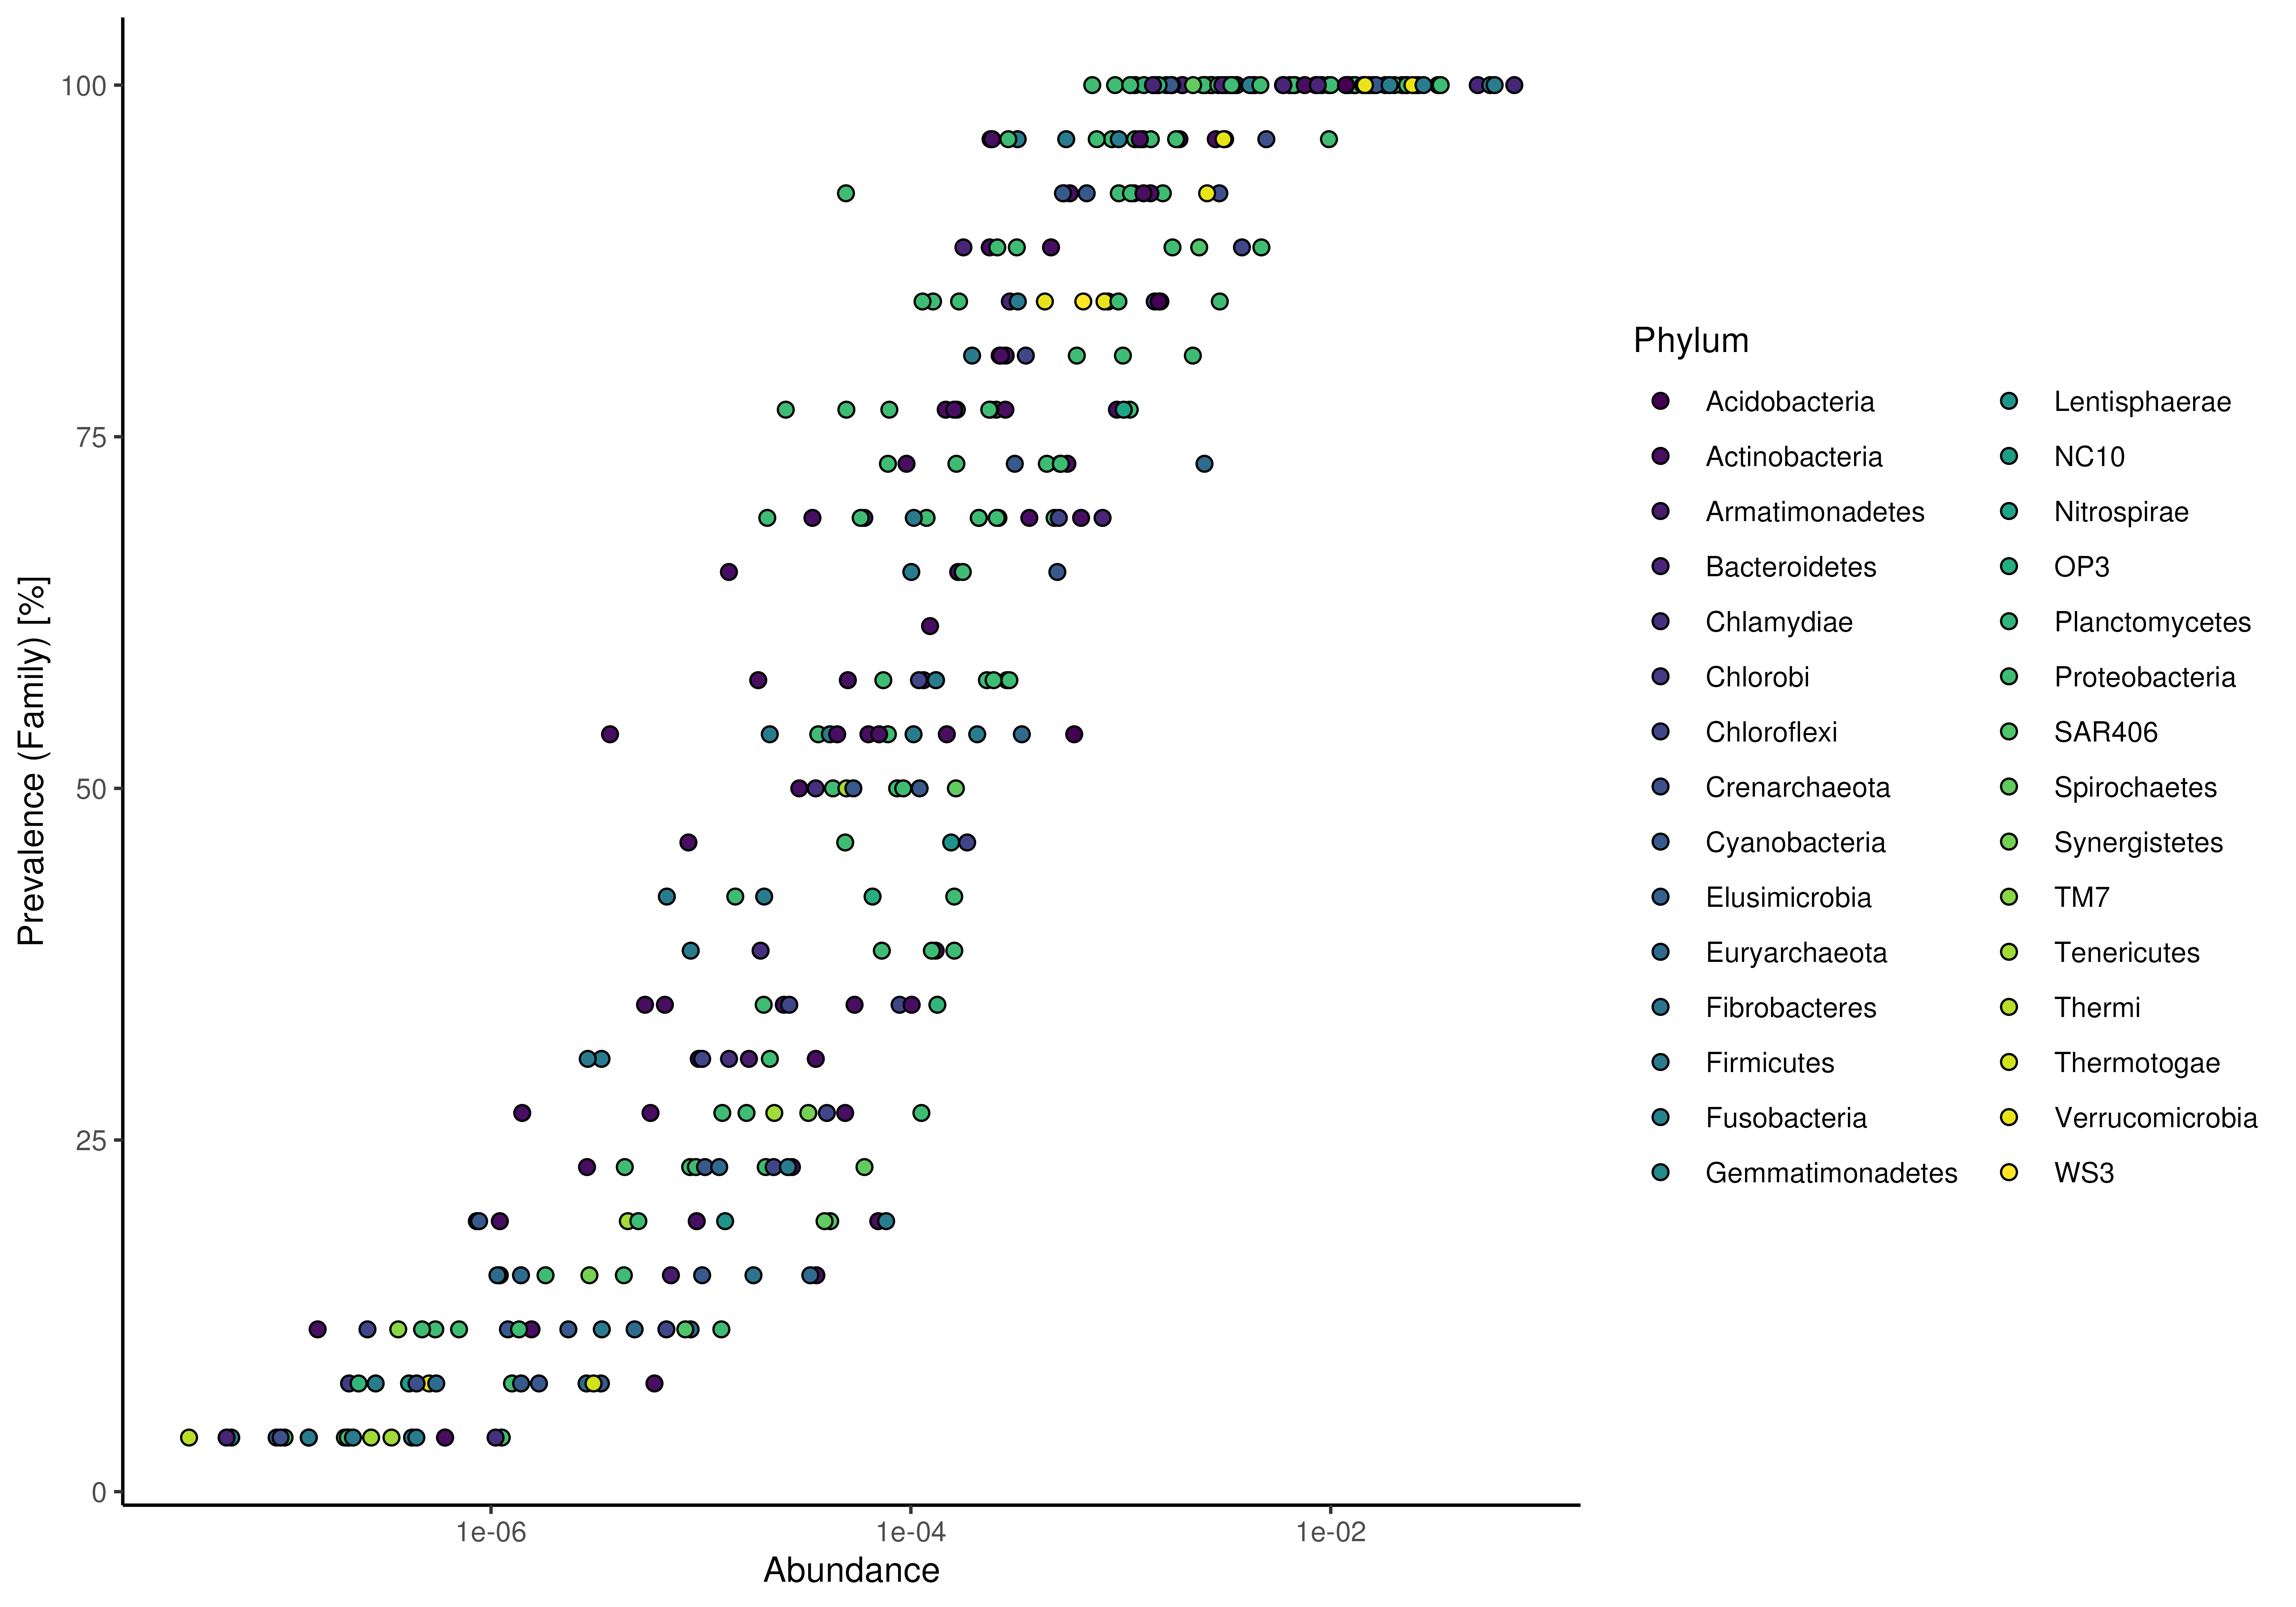
 # point layout for plotRowPrevalence can be used to visualize by additional
# information
plotPrevalentAbundance(
GlobalPatterns, rank = "Family", colour.by = "Phylum") +
scale_x_log10()
#> Duplicated labels were made unique.
# point layout for plotRowPrevalence can be used to visualize by additional
# information
plotPrevalentAbundance(
GlobalPatterns, rank = "Family", colour.by = "Phylum") +
scale_x_log10()
#> Duplicated labels were made unique.
 # When using function plotPrevalentAbundace, it is possible to create facets
# with 'facet.by'.
plotPrevalentAbundance(
GlobalPatterns, rank = "Family",
colour.by = "Phylum", facet.by = "Kingdom") +
scale_x_log10()
#> Duplicated labels were made unique.
# When using function plotPrevalentAbundace, it is possible to create facets
# with 'facet.by'.
plotPrevalentAbundance(
GlobalPatterns, rank = "Family",
colour.by = "Phylum", facet.by = "Kingdom") +
scale_x_log10()
#> Duplicated labels were made unique.
