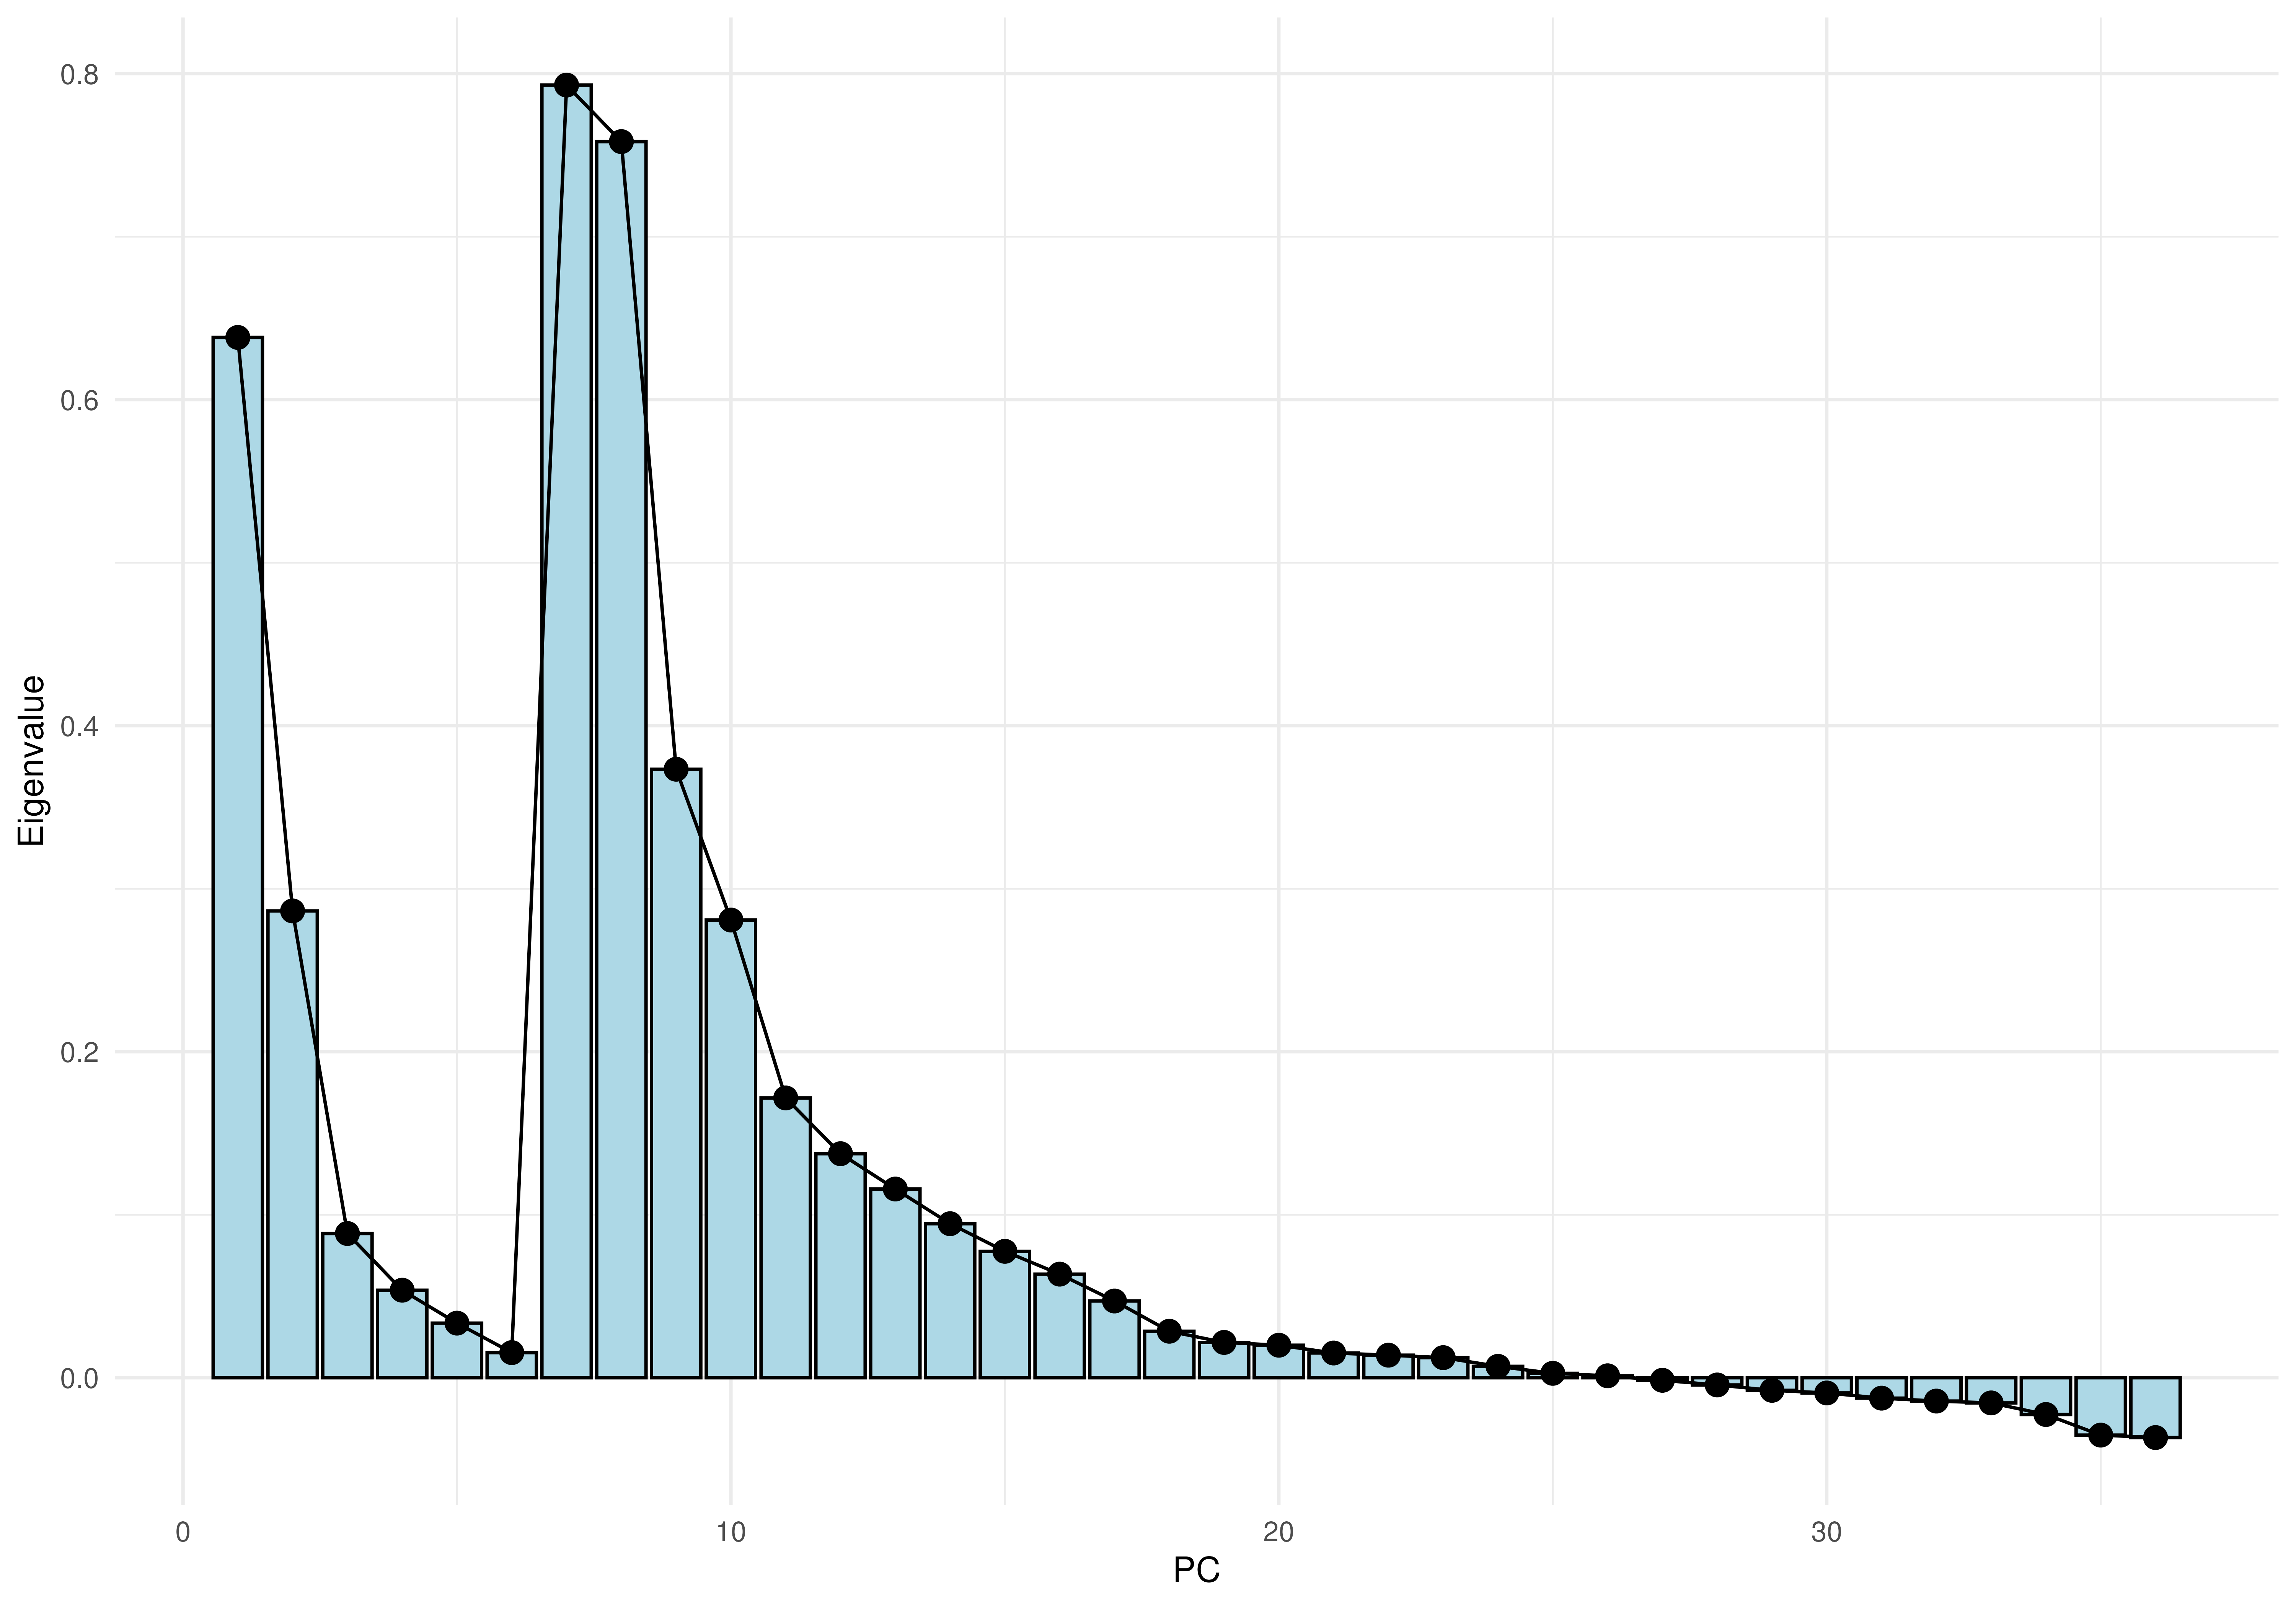
plotScree generates a scree plot to visualize the eigenvalues.
The eigenvalues can be provided either as a part of a
TreeSummarizedExperiment object or as a separate vector.
This plot illustrates the decline in eigenvalues across components,
helping to assess the importance of each component.
plotScree(x, ...)

# S4 method for class 'SingleCellExperiment'
plotScree(x, dimred, ...)

# S4 method for class 'ANY'
plotScree(x, ...)
Arguments
- x
a
TreeSummarizedExperimenteigenvalsor a vector.- ...
additional parameters for plotting
show.barplot:Logical scalar. Whether to show a barplot. (Default:TRUE)show.points:Logical scalar. Whether to show a points. (Default:TRUE)show.line:Logical scalar. Whether to show a line. (Default:TRUE)show.labels:Logical scalar. Whether to show a labels for each point. (Default:FALSE)add.proportion:Logical scalar. Whether to show proportion of explained variance, i.e., raw eigenvalues. (Default:TRUE)add.cumulative:Logical scalar. Whether to show cumulative explained variance calculated from eigenvalues. (Default:FALSE)n:Integer scalar. Number of eigenvalues to plot. IfNULL, all eigenvalues are plotted. (Default:NULL)show.names:Logical scalar. Whether to show names of components in x-axis. IfFALSE, the index of component is shown instead of names. (Default:FALSE)eig.name:Character scalar. The name of the attribute inreducedDim(x, dimred)that contains the eigenvalues. (Default:c("eig", "varExplained"))
- dimred
Character scalarorinteger scalar. Determines the reduced dimension to plot. This is used whenxis aTreeSummarizedExperimentto extract the eigenvalues fromreducedDim(x, dimred).
Value
A ggplot2 object
Details
plotScree generates a scree plot to visualize the relative importance
of components in dimensionality reduction techniques such as Principal
Component Analysis (PCA) or Principal Coordinate Analysis (PCoA). If the
input is a TreeSummarizedExperiment object, the function extracts
eigenvalues from the specified reduced dimension slot, which requires that
dimensionality reduction has been performed beforehand using a dedicated
function. Alternatively, if the input is a vector or an
eigenvals object, these values are directly used as eigenvalues for
the plot.
The plot can include a combination of barplot, points, connecting lines,
and labels, which can be controlled using the show.* parameters.
An option to show cumulative explained variance is also available by setting
add.cumulative = TRUE.
Examples
library(miaViz)
library(scater)

data("enterotype", package = "mia")
tse <- enterotype

# Run  PCA and store results into TreeSE
tse <- transformAssay(tse, method = "clr", pseudocount = TRUE)
#> A pseudocount of 5e-09 was applied.
tse <- runPCA(tse, assay.type = "clr")

# Plot scree plot
plotScree(tse, "PCA", add.cumulative = TRUE)