Plotting tree information enriched with information
Source:R/AllGenerics.R, R/plotTree.R
plotTree.RdBased on the stored data in a TreeSummarizedExperiment a tree can
be plotted. From the rowData, the assays as well as the
colData information can be taken for enriching the tree plots with
additional information.
plotRowTree(x, ...)

plotColTree(x, ...)

# S4 method for class 'TreeSummarizedExperiment'
plotColTree(x, tree.name = "phylo", ...)

# S4 method for class 'TreeSummarizedExperiment'
plotRowTree(x, tree.name = "phylo", ...)
Arguments
- x
- ...
additional arguments for plotting.
layout: layout for the plotted tree. Seeggtreefor details.relabel.tree:Logical scalar. Should the tip labels be relabelec using the output ofgetTaxonomyLabels(x, with_rank = TRUE)? (Default:FALSE)order.tree:Logical scalar. Should the tree be ordered based on alphabetic order of taxonomic levels? (Default:FALSE)levels.rm:Logical scalar. Should taxonomic level information be removed from labels? (Default:FALSE)show.label,show.highlights,show.highlight.label,abbr.labellogical vector,integer vector. orcharacter vector. If alogicalscalar is given, should tip labels be plotted or if a logical vector is provided, which labels should be shown? If anintegerorcharactervector is provided, it will be converted to a logical vector. Theintegervalues must be in the range of 1 and number of nodes, whereas the values of acharactervector must match values of thelabelcolumn in the node data. In case of acharactervector only values corresponding to actual labels will be plotted and if no labels are provided no labels will be shown. (Default:FALSE)add.legend:Logical scalar. Should legends be plotted? (Default:TRUE)edge.colour.by:Character scalar. Specification of a column metadata field or a feature to colour tree edges by. (Default:NULL)edge.size.by:Character scalar. Specification of a column metadata field or a feature to size tree edges by. (Default:NULL)colour.by:Character scalar. Specification of a column metadata field or a feature to colour tree nodes by. (Default:NULL)shape.by:Character scalar. Specification of a column metadata field or a feature to shape tree nodes by. (Default:NULL)size.by:Character scalar. Specification of a column metadata field or a feature to size tree tips by. (Default:NULL)show.tips:Logical scalar. Whether to show tip points. (Default:FALSE)show.nodes:Logical scalar. Whether to show node points. (Default:FALSE)colour.highlights.by:Logical scalar. Should the highlights be colour differently? Ifshow.highlights = TRUE,colour_highlightswill be set toTRUEas default. (Default:FALSE)assay.type:Character scalar. Specifies which assay to obtain expression values from, for use in point aesthetics. (Default:"counts")other.fields:Character vector. Additional fields to include in the node information without plotting them. (Default:NULL)
- tree.name
Character scalar. Specifies a rowTree/colTree fromx. (Default:tree.name = "phylo")
Value
a ggtree plot
Details
If show.label or show.highlight.label have the same length
as the number of nodes, the vector will be used to relabel the nodes.
See also
Examples
library(scater)
library(mia)
# preparation of some data
data(GlobalPatterns)
GlobalPatterns <- agglomerateByRanks(GlobalPatterns)
#> Duplicated labels were made unique.
#> Duplicated labels were made unique.
altExp(GlobalPatterns,"Genus") <- addPerFeatureQC(
altExp(GlobalPatterns,"Genus"))
rowData(altExp(GlobalPatterns,"Genus"))$log_mean <- log(
rowData(altExp(GlobalPatterns,"Genus"))$mean)
rowData(altExp(GlobalPatterns,"Genus"))$detected <- rowData(
altExp(GlobalPatterns,"Genus"))$detected / 100
top_genus <- getTop(
altExp(GlobalPatterns,"Genus"),
method = "mean",
top = 100L,
assay.type = "counts"
)
#
x <- altExp(GlobalPatterns,"Genus")
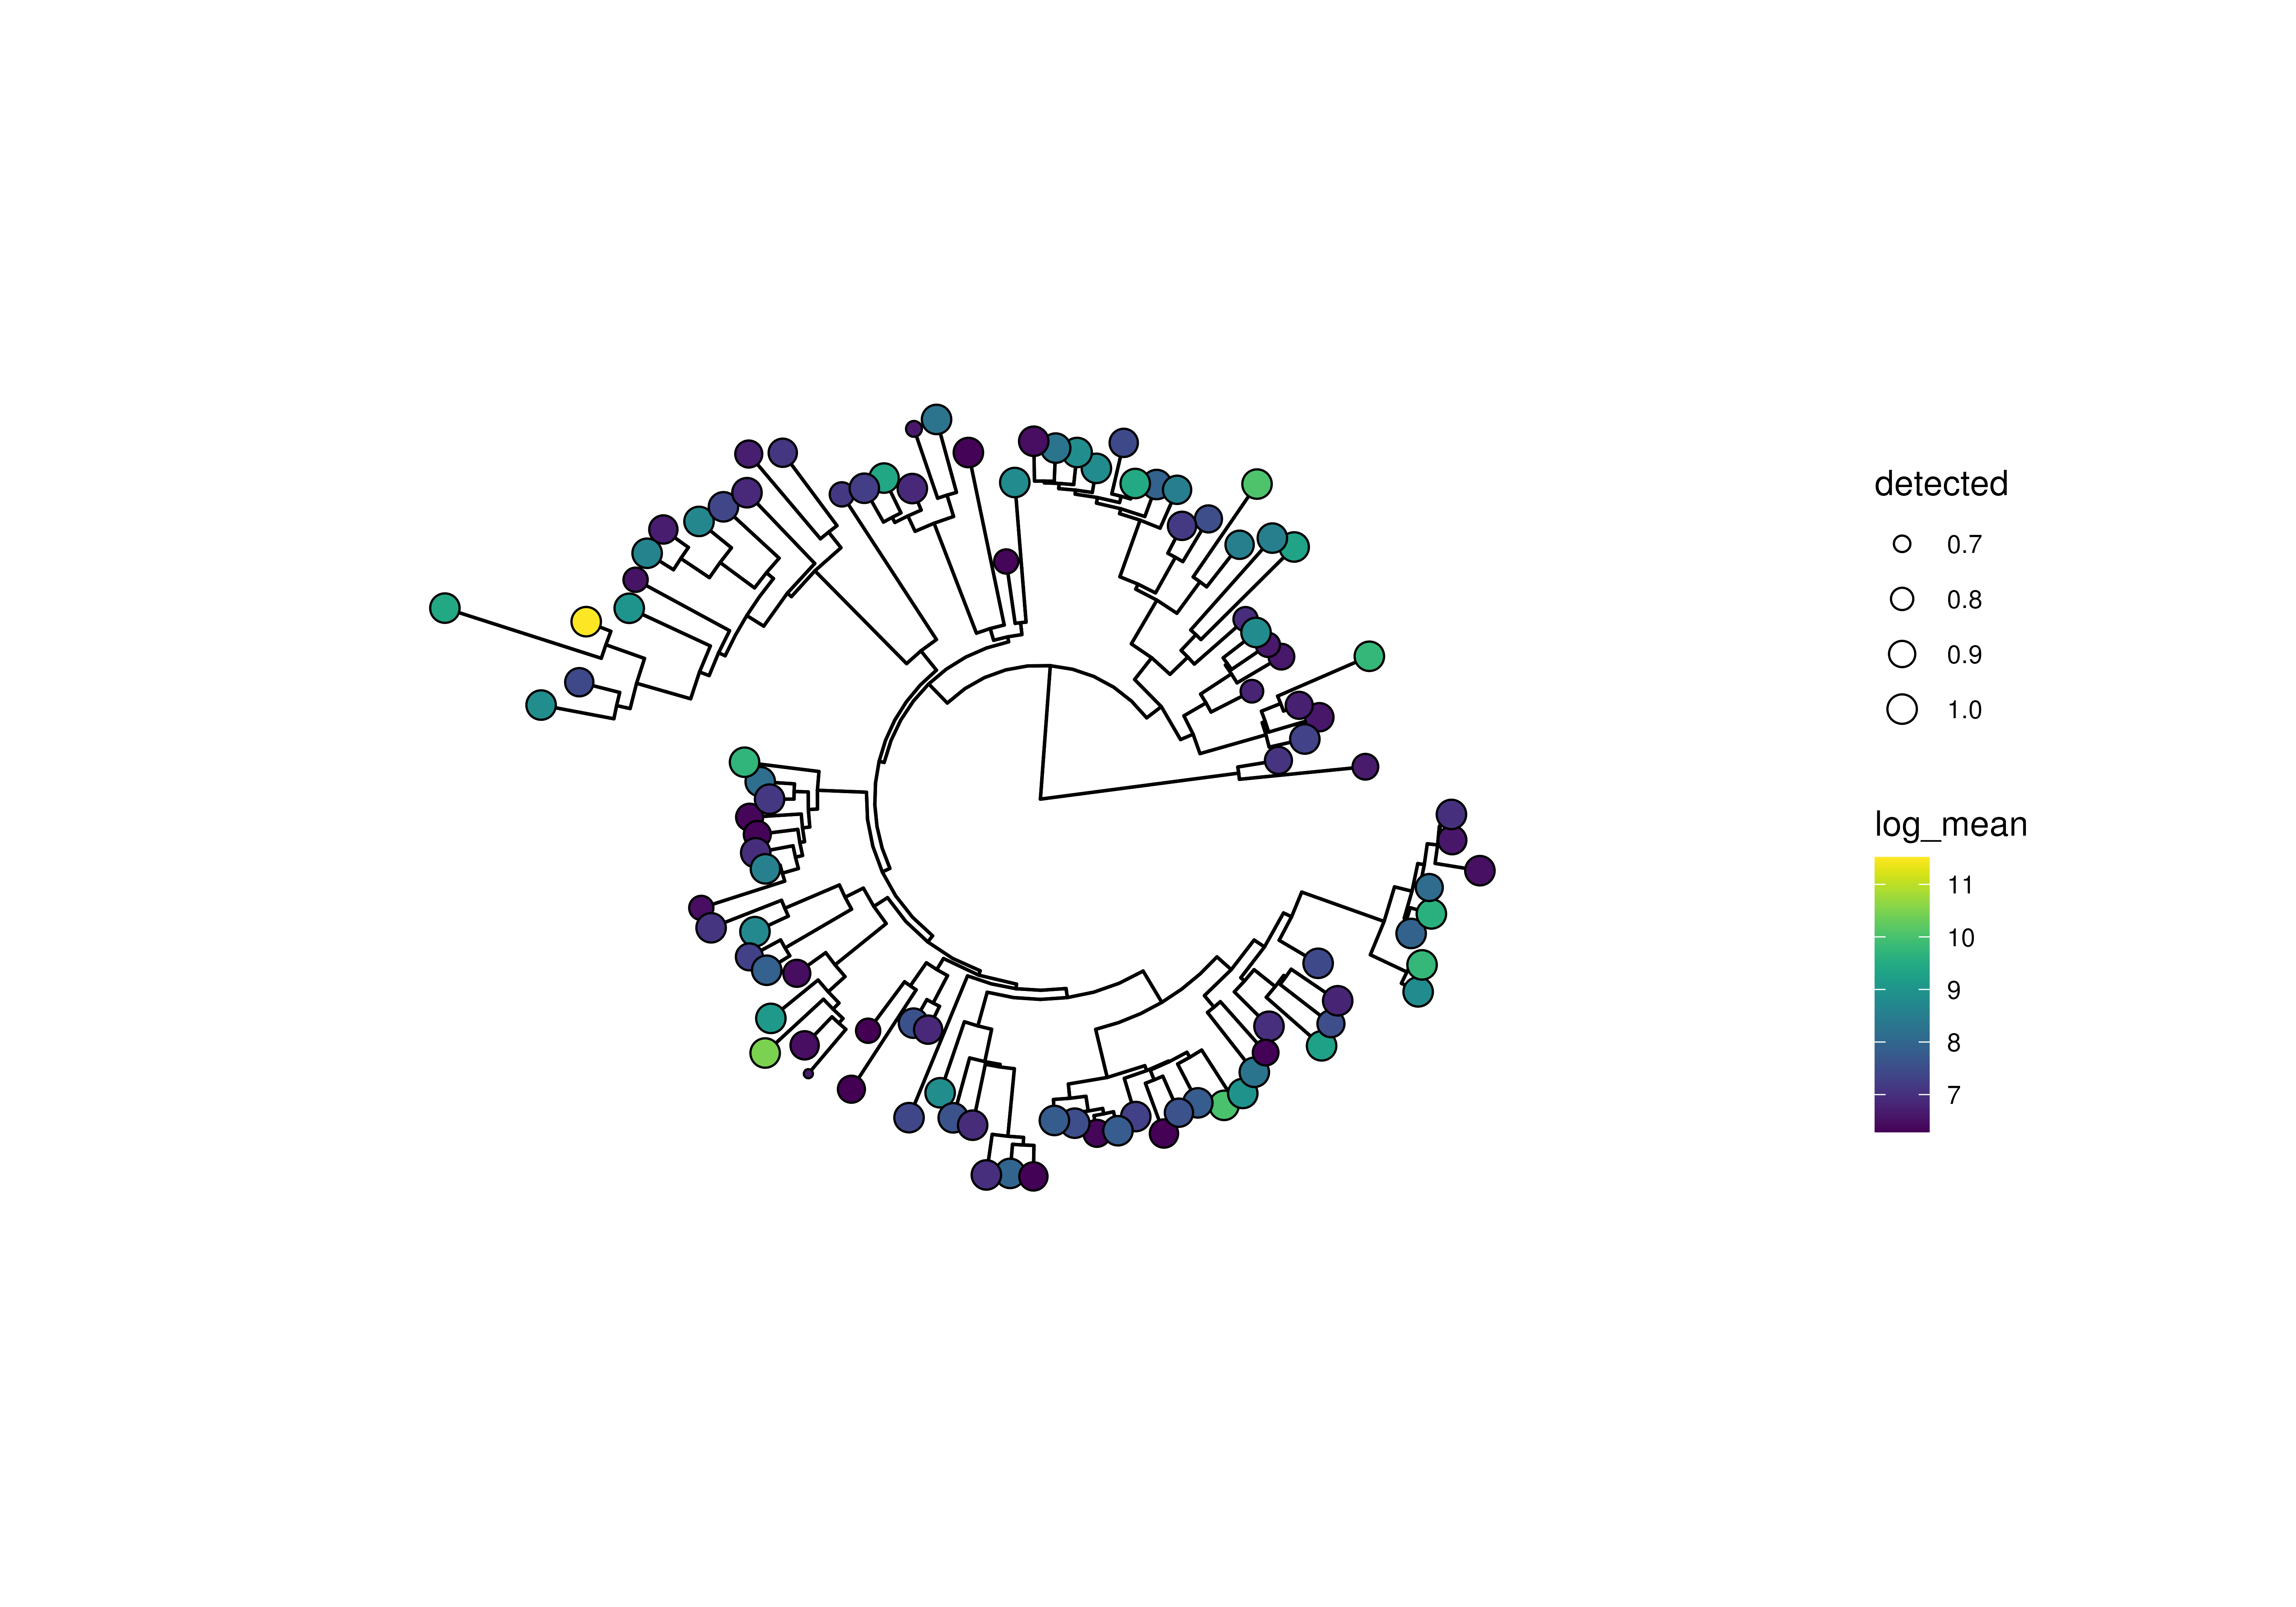
plotRowTree(
x[rownames(x) %in% top_genus,],
tip.colour.by = "log_mean", tip.size.by = "detected"
)
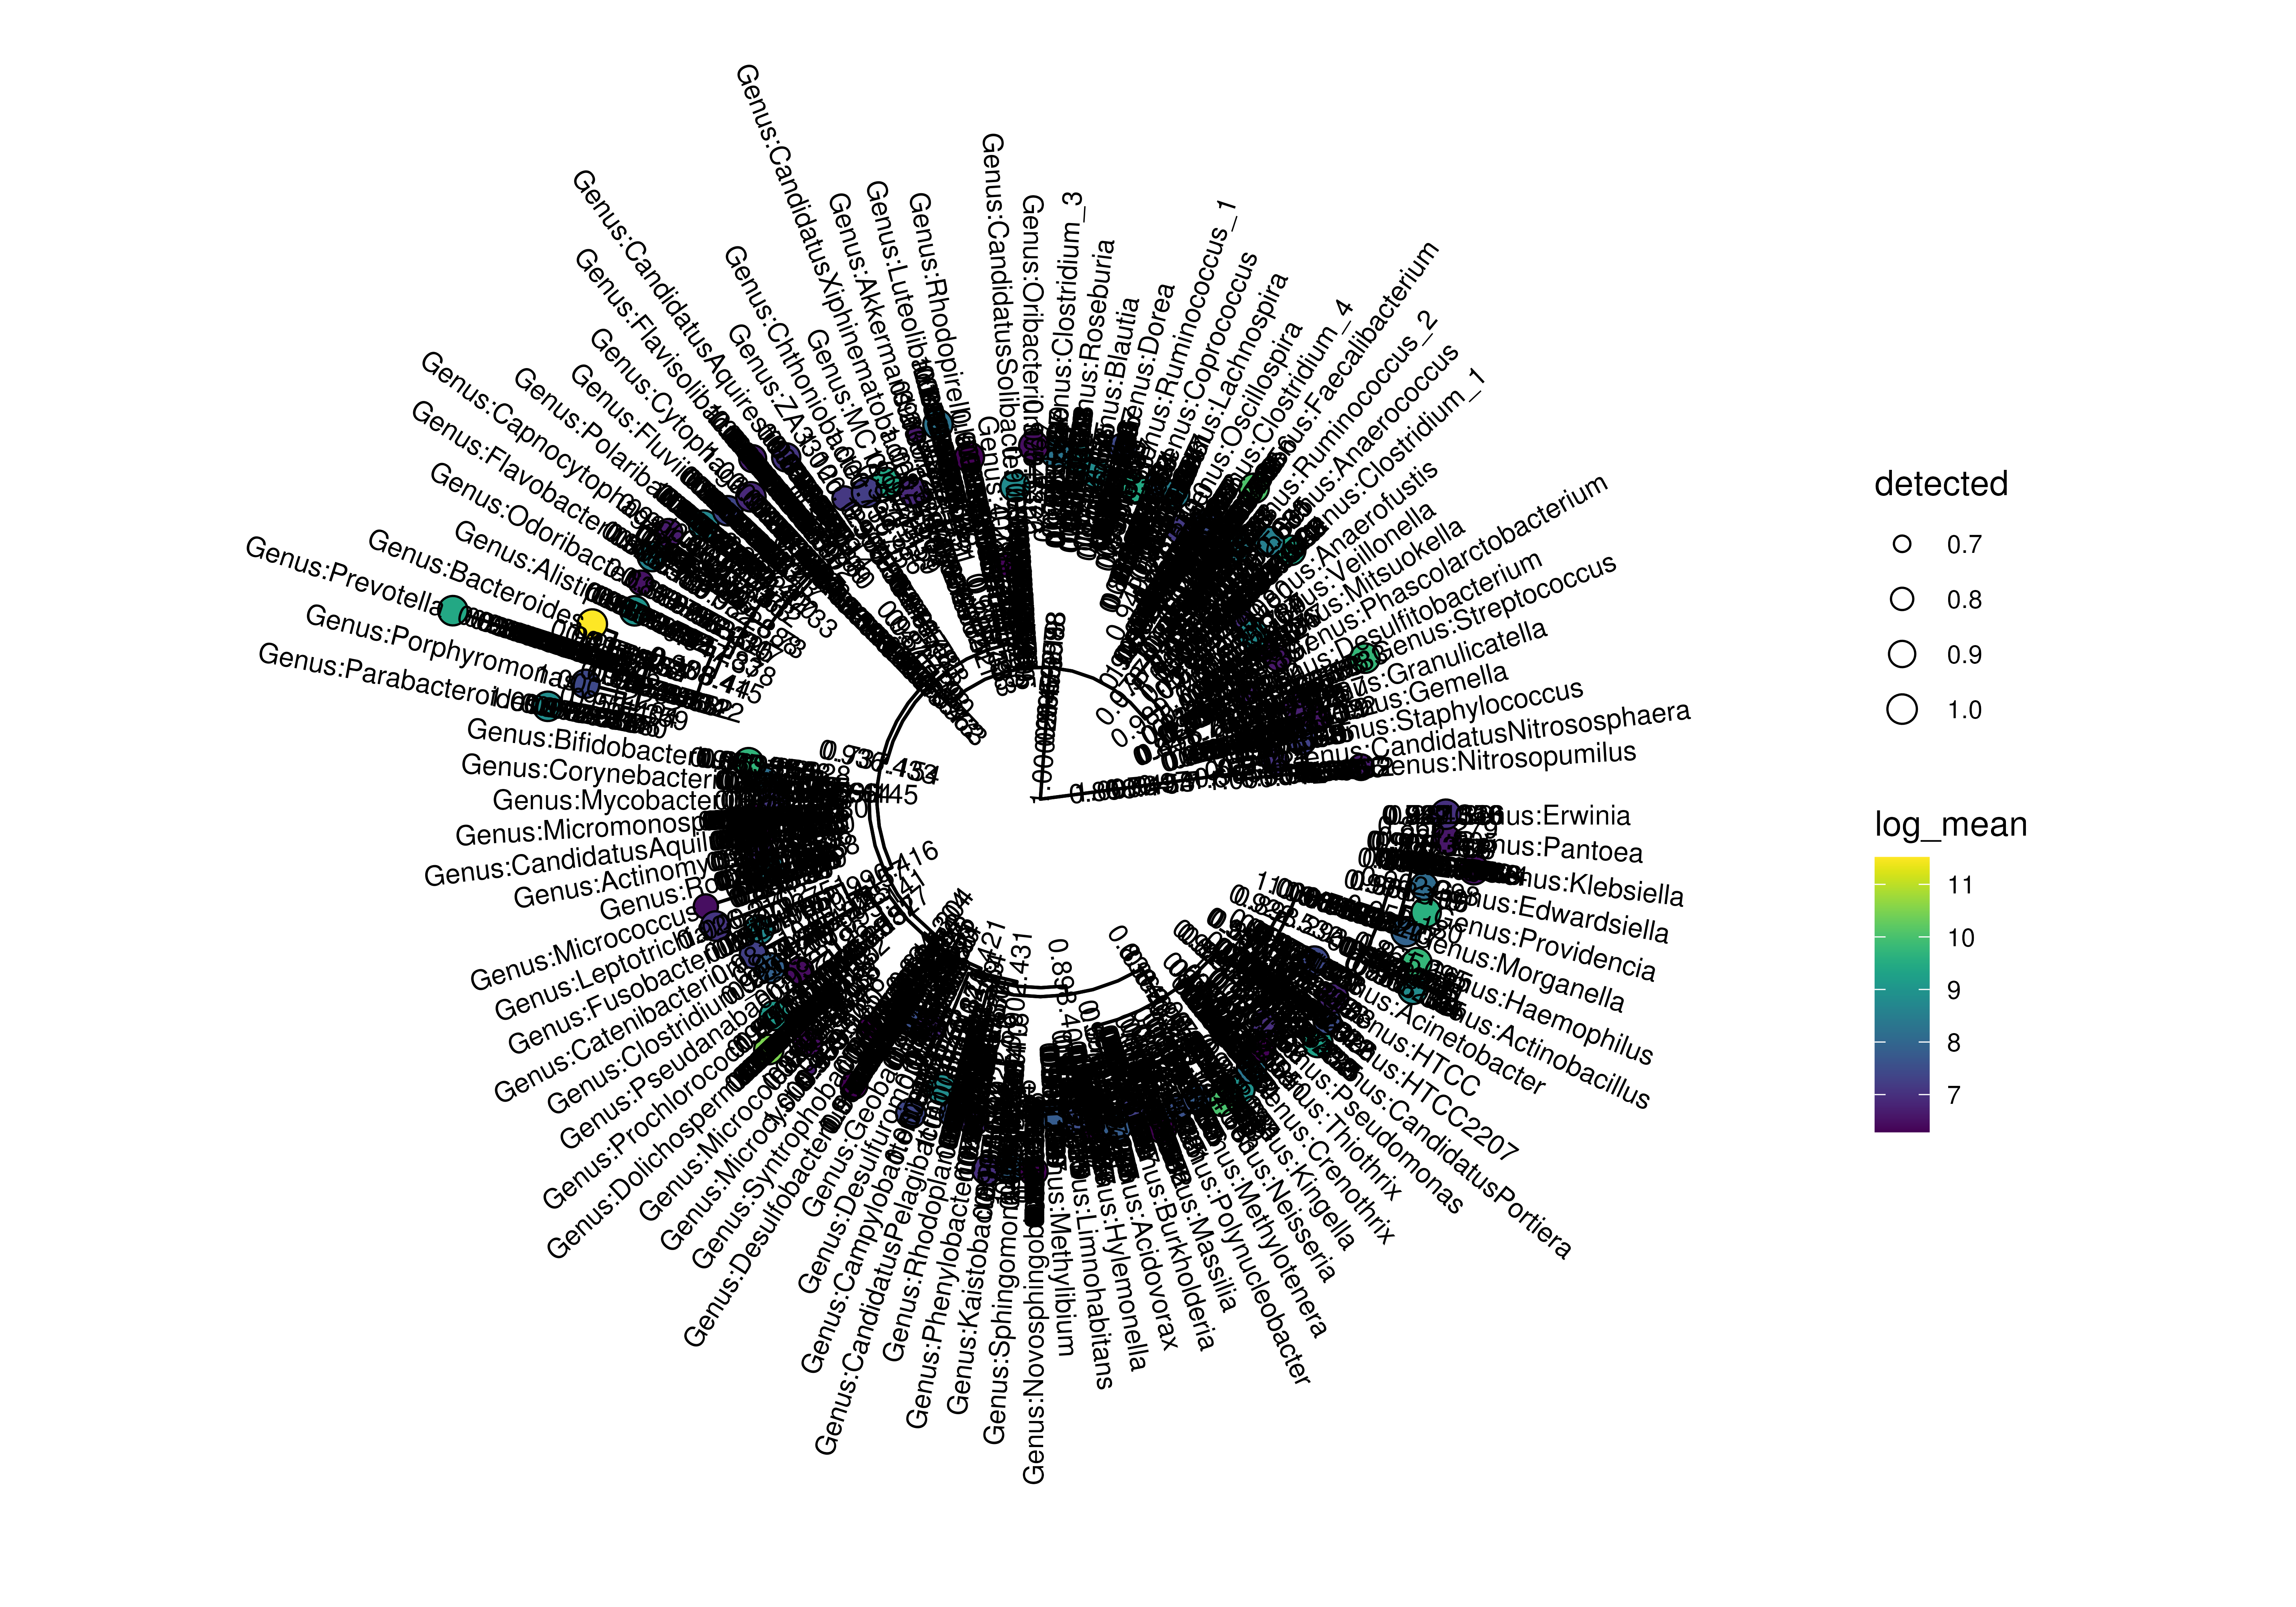
 # plot with tip labels
plotRowTree(
x[rownames(x) %in% top_genus,],
tip.colour.by = "log_mean",
tip.size.by = "detected",
show.label = TRUE
)
# plot with tip labels
plotRowTree(
x[rownames(x) %in% top_genus,],
tip.colour.by = "log_mean",
tip.size.by = "detected",
show.label = TRUE
)
 # plot with selected labels
labels <- c("Genus:Providencia", "Genus:Morganella", "0.961.60")
plotRowTree(
x[rownames(x) %in% top_genus,],
tip.colour.by = "log_mean",
tip.size.by = "detected",
show.label = labels,
layout = "rectangular"
)
# plot with selected labels
labels <- c("Genus:Providencia", "Genus:Morganella", "0.961.60")
plotRowTree(
x[rownames(x) %in% top_genus,],
tip.colour.by = "log_mean",
tip.size.by = "detected",
show.label = labels,
layout = "rectangular"
)
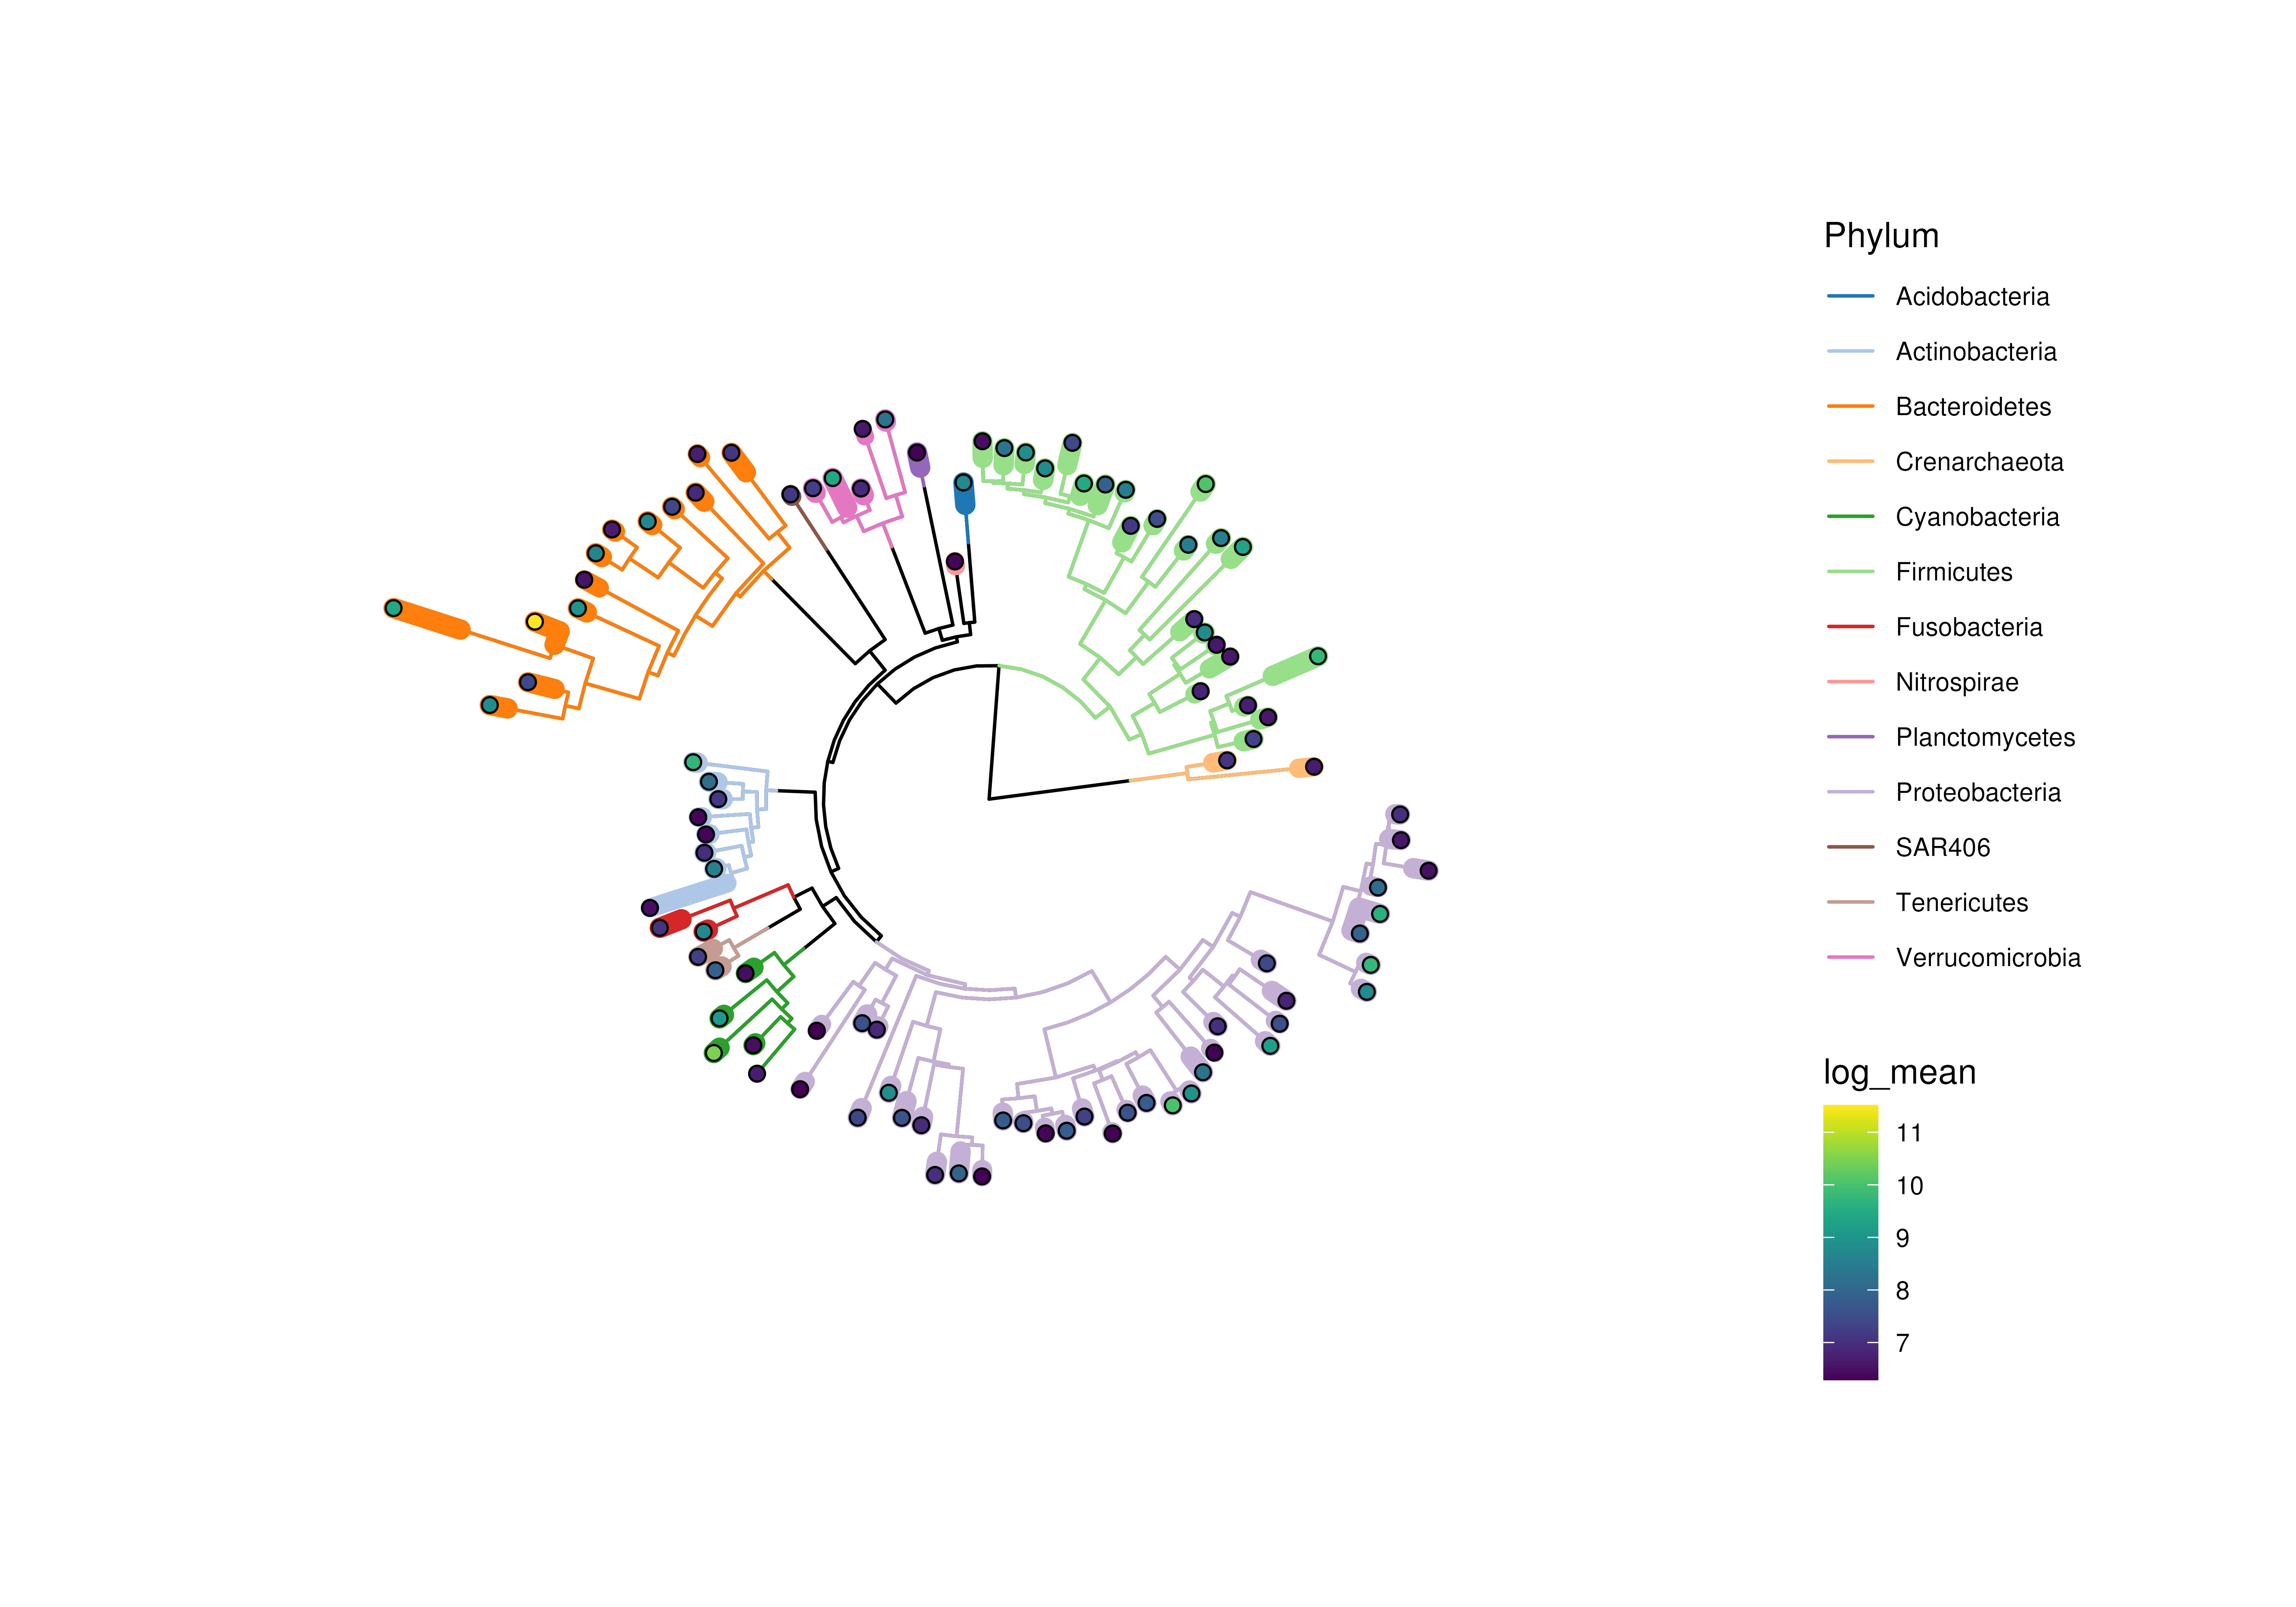
 # plot with labeled edges
plotRowTree(
x[rownames(x) %in% top_genus,],
edge.colour.by = "Phylum",
tip.colour.by = "log_mean"
)
# plot with labeled edges
plotRowTree(
x[rownames(x) %in% top_genus,],
edge.colour.by = "Phylum",
tip.colour.by = "log_mean"
)
 # if edges are sized, colours might disappear depending on plotting device
plotRowTree(
x[rownames(x) %in% top_genus,],
node.colour.by = "Phylum",
edge.size.by = "detected",
edge.colour.by = "log_mean"
)
#> Warning: Using `size` aesthetic for lines was deprecated in ggplot2 3.4.0.
#> ℹ Please use `linewidth` instead.
#> ℹ The deprecated feature was likely used in the ggtree package.
#> Please report the issue at <https://github.com/YuLab-SMU/ggtree/issues>.
# if edges are sized, colours might disappear depending on plotting device
plotRowTree(
x[rownames(x) %in% top_genus,],
node.colour.by = "Phylum",
edge.size.by = "detected",
edge.colour.by = "log_mean"
)
#> Warning: Using `size` aesthetic for lines was deprecated in ggplot2 3.4.0.
#> ℹ Please use `linewidth` instead.
#> ℹ The deprecated feature was likely used in the ggtree package.
#> Please report the issue at <https://github.com/YuLab-SMU/ggtree/issues>.
 # aggregating data over the taxonomic levels for plotting a taxonomic tree
# please note that the original tree of GlobalPatterns is dropped by
# unsplitByRanks
altExps(GlobalPatterns) <- splitByRanks(GlobalPatterns)
#> Duplicated labels were made unique.
#> Duplicated labels were made unique.
top_phyla <- getTop(
altExp(GlobalPatterns,"Phylum"),
method = "mean",
top = 10L,
assay.type="counts"
)
altExps(GlobalPatterns) <- lapply(altExps(GlobalPatterns), addPerFeatureQC)
altExps(GlobalPatterns) <- lapply(
altExps(GlobalPatterns), function(y){
rowData(y)$log_mean <- log(rowData(y)$mean)
rowData(y)$detected <- rowData(y)$detected / 100
return(y)
})
x <- unsplitByRanks(GlobalPatterns)
x <- addHierarchyTree(x)
#> Warning: The root is added with label 'ALL'
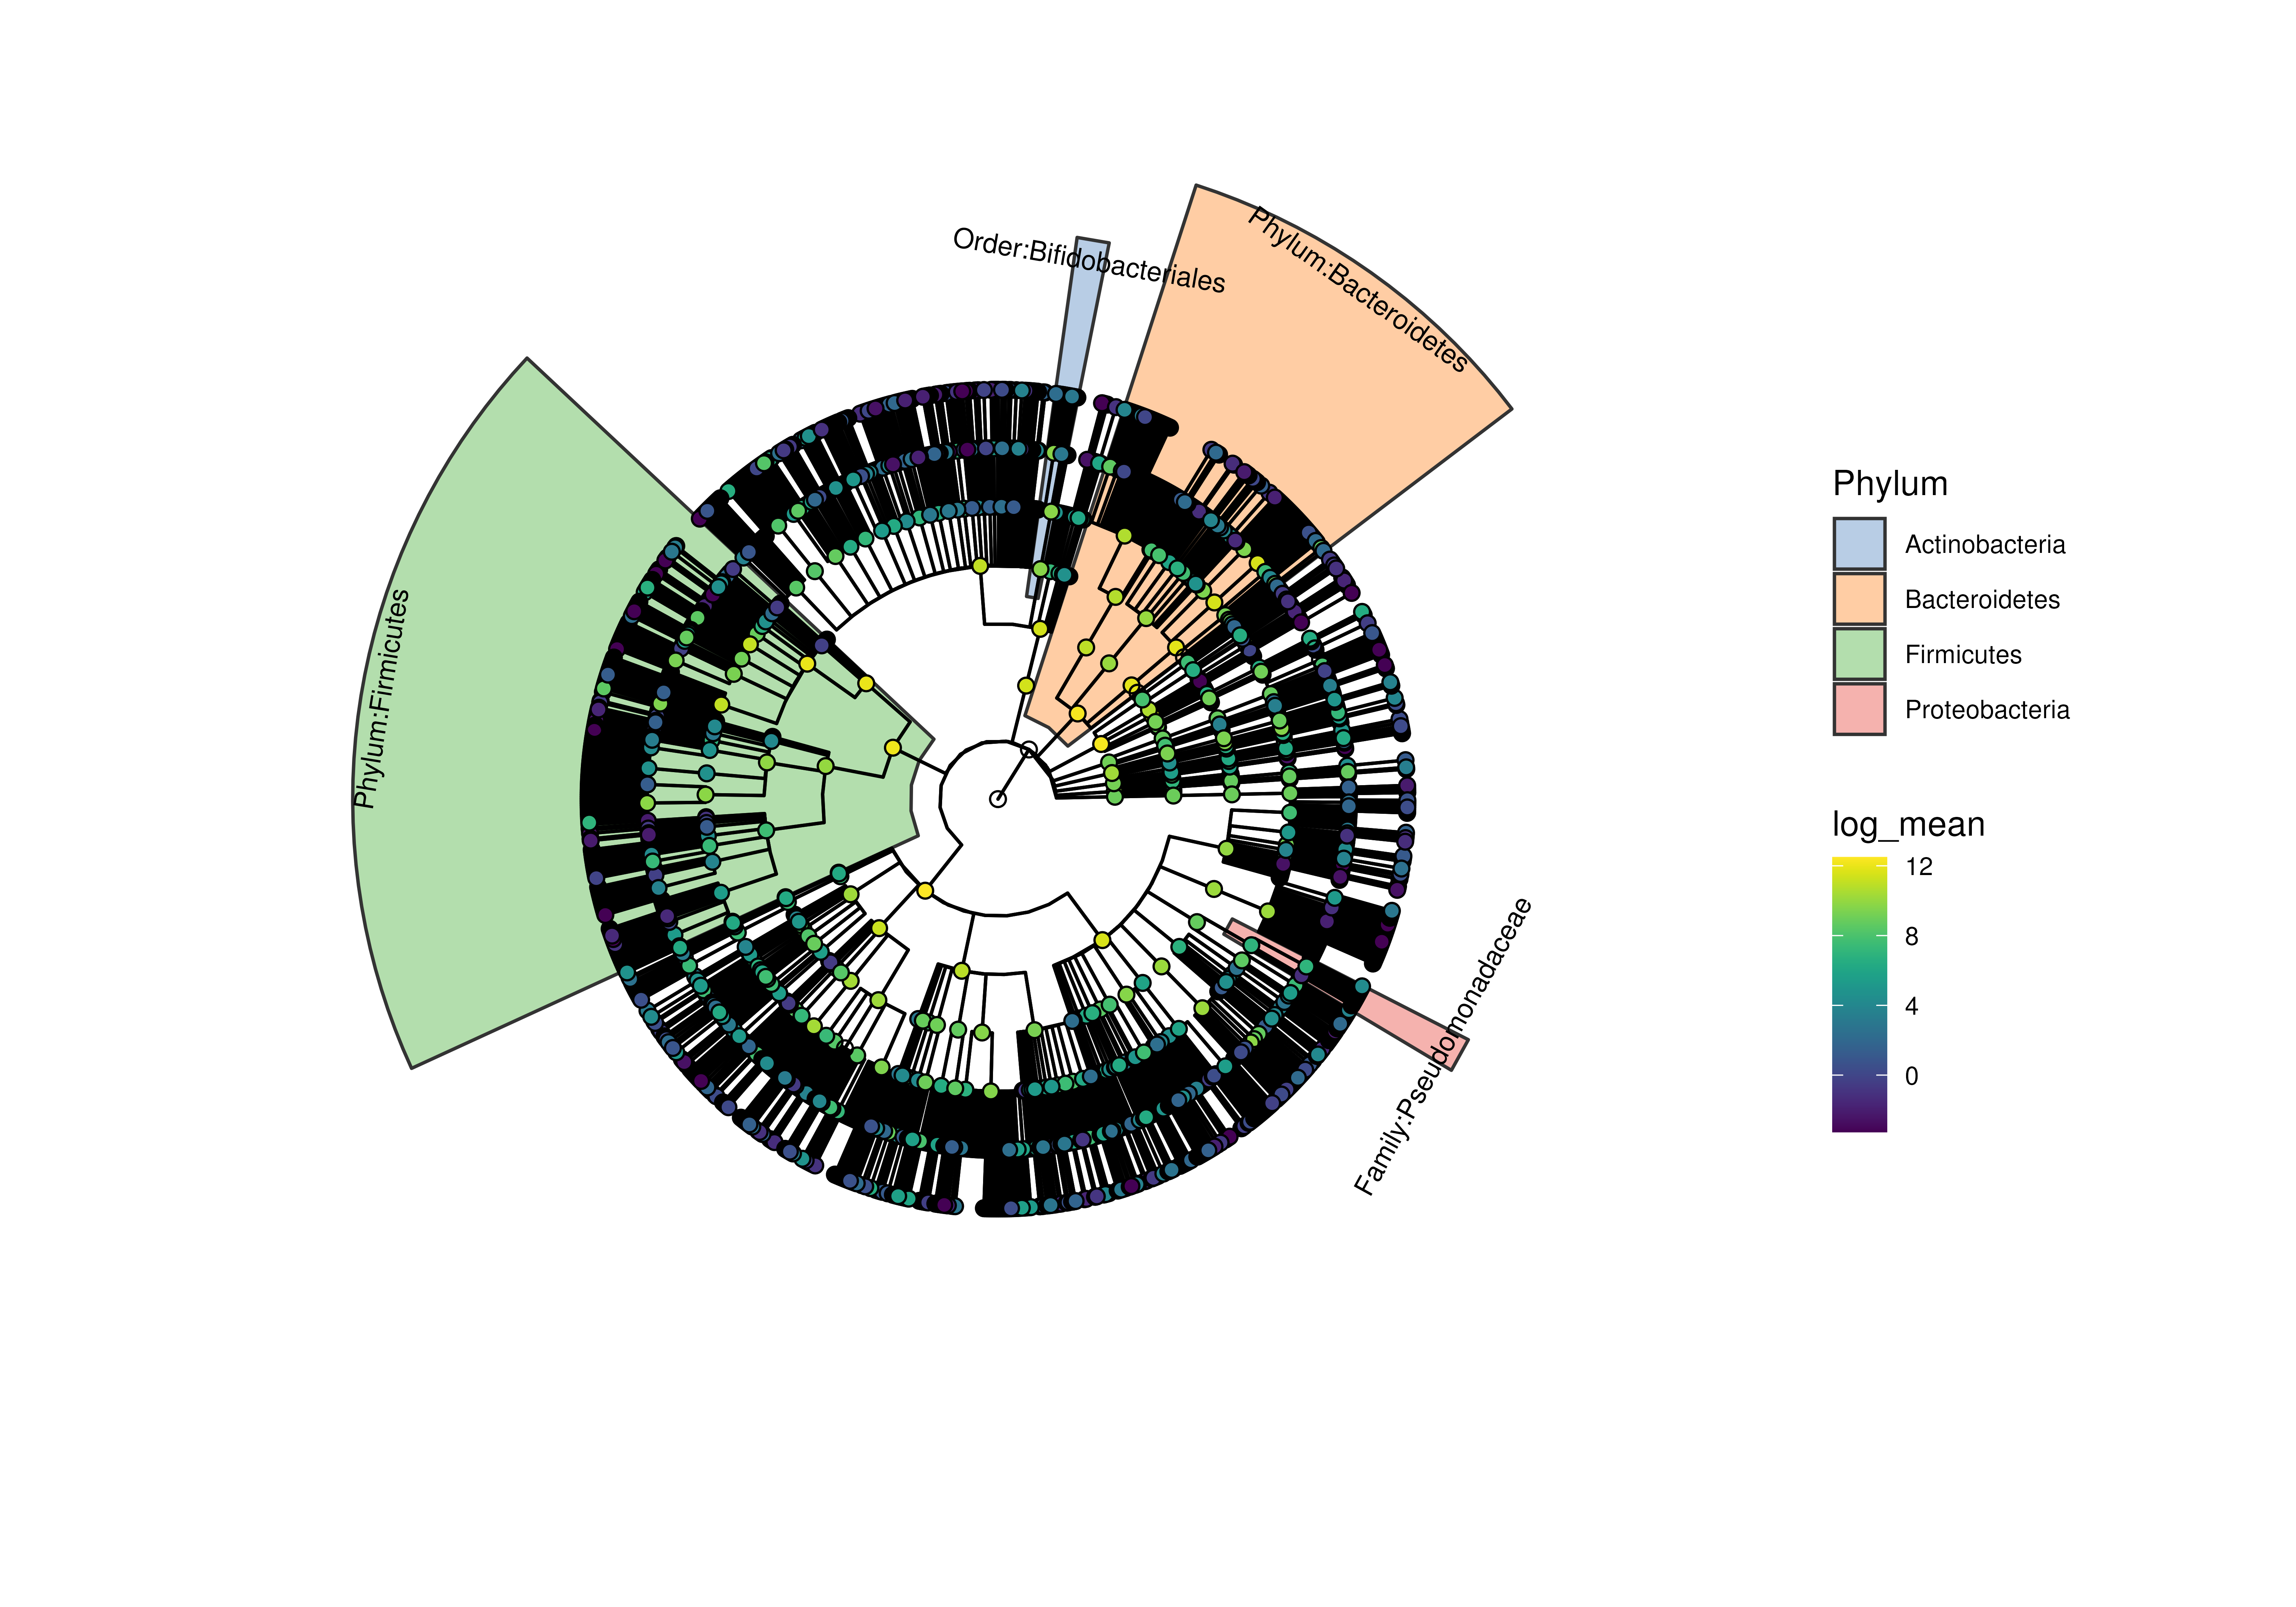
highlights <- c(
"Phylum:Firmicutes","Phylum:Bacteroidetes",
"Family:Pseudomonadaceae","Order:Bifidobacteriales")
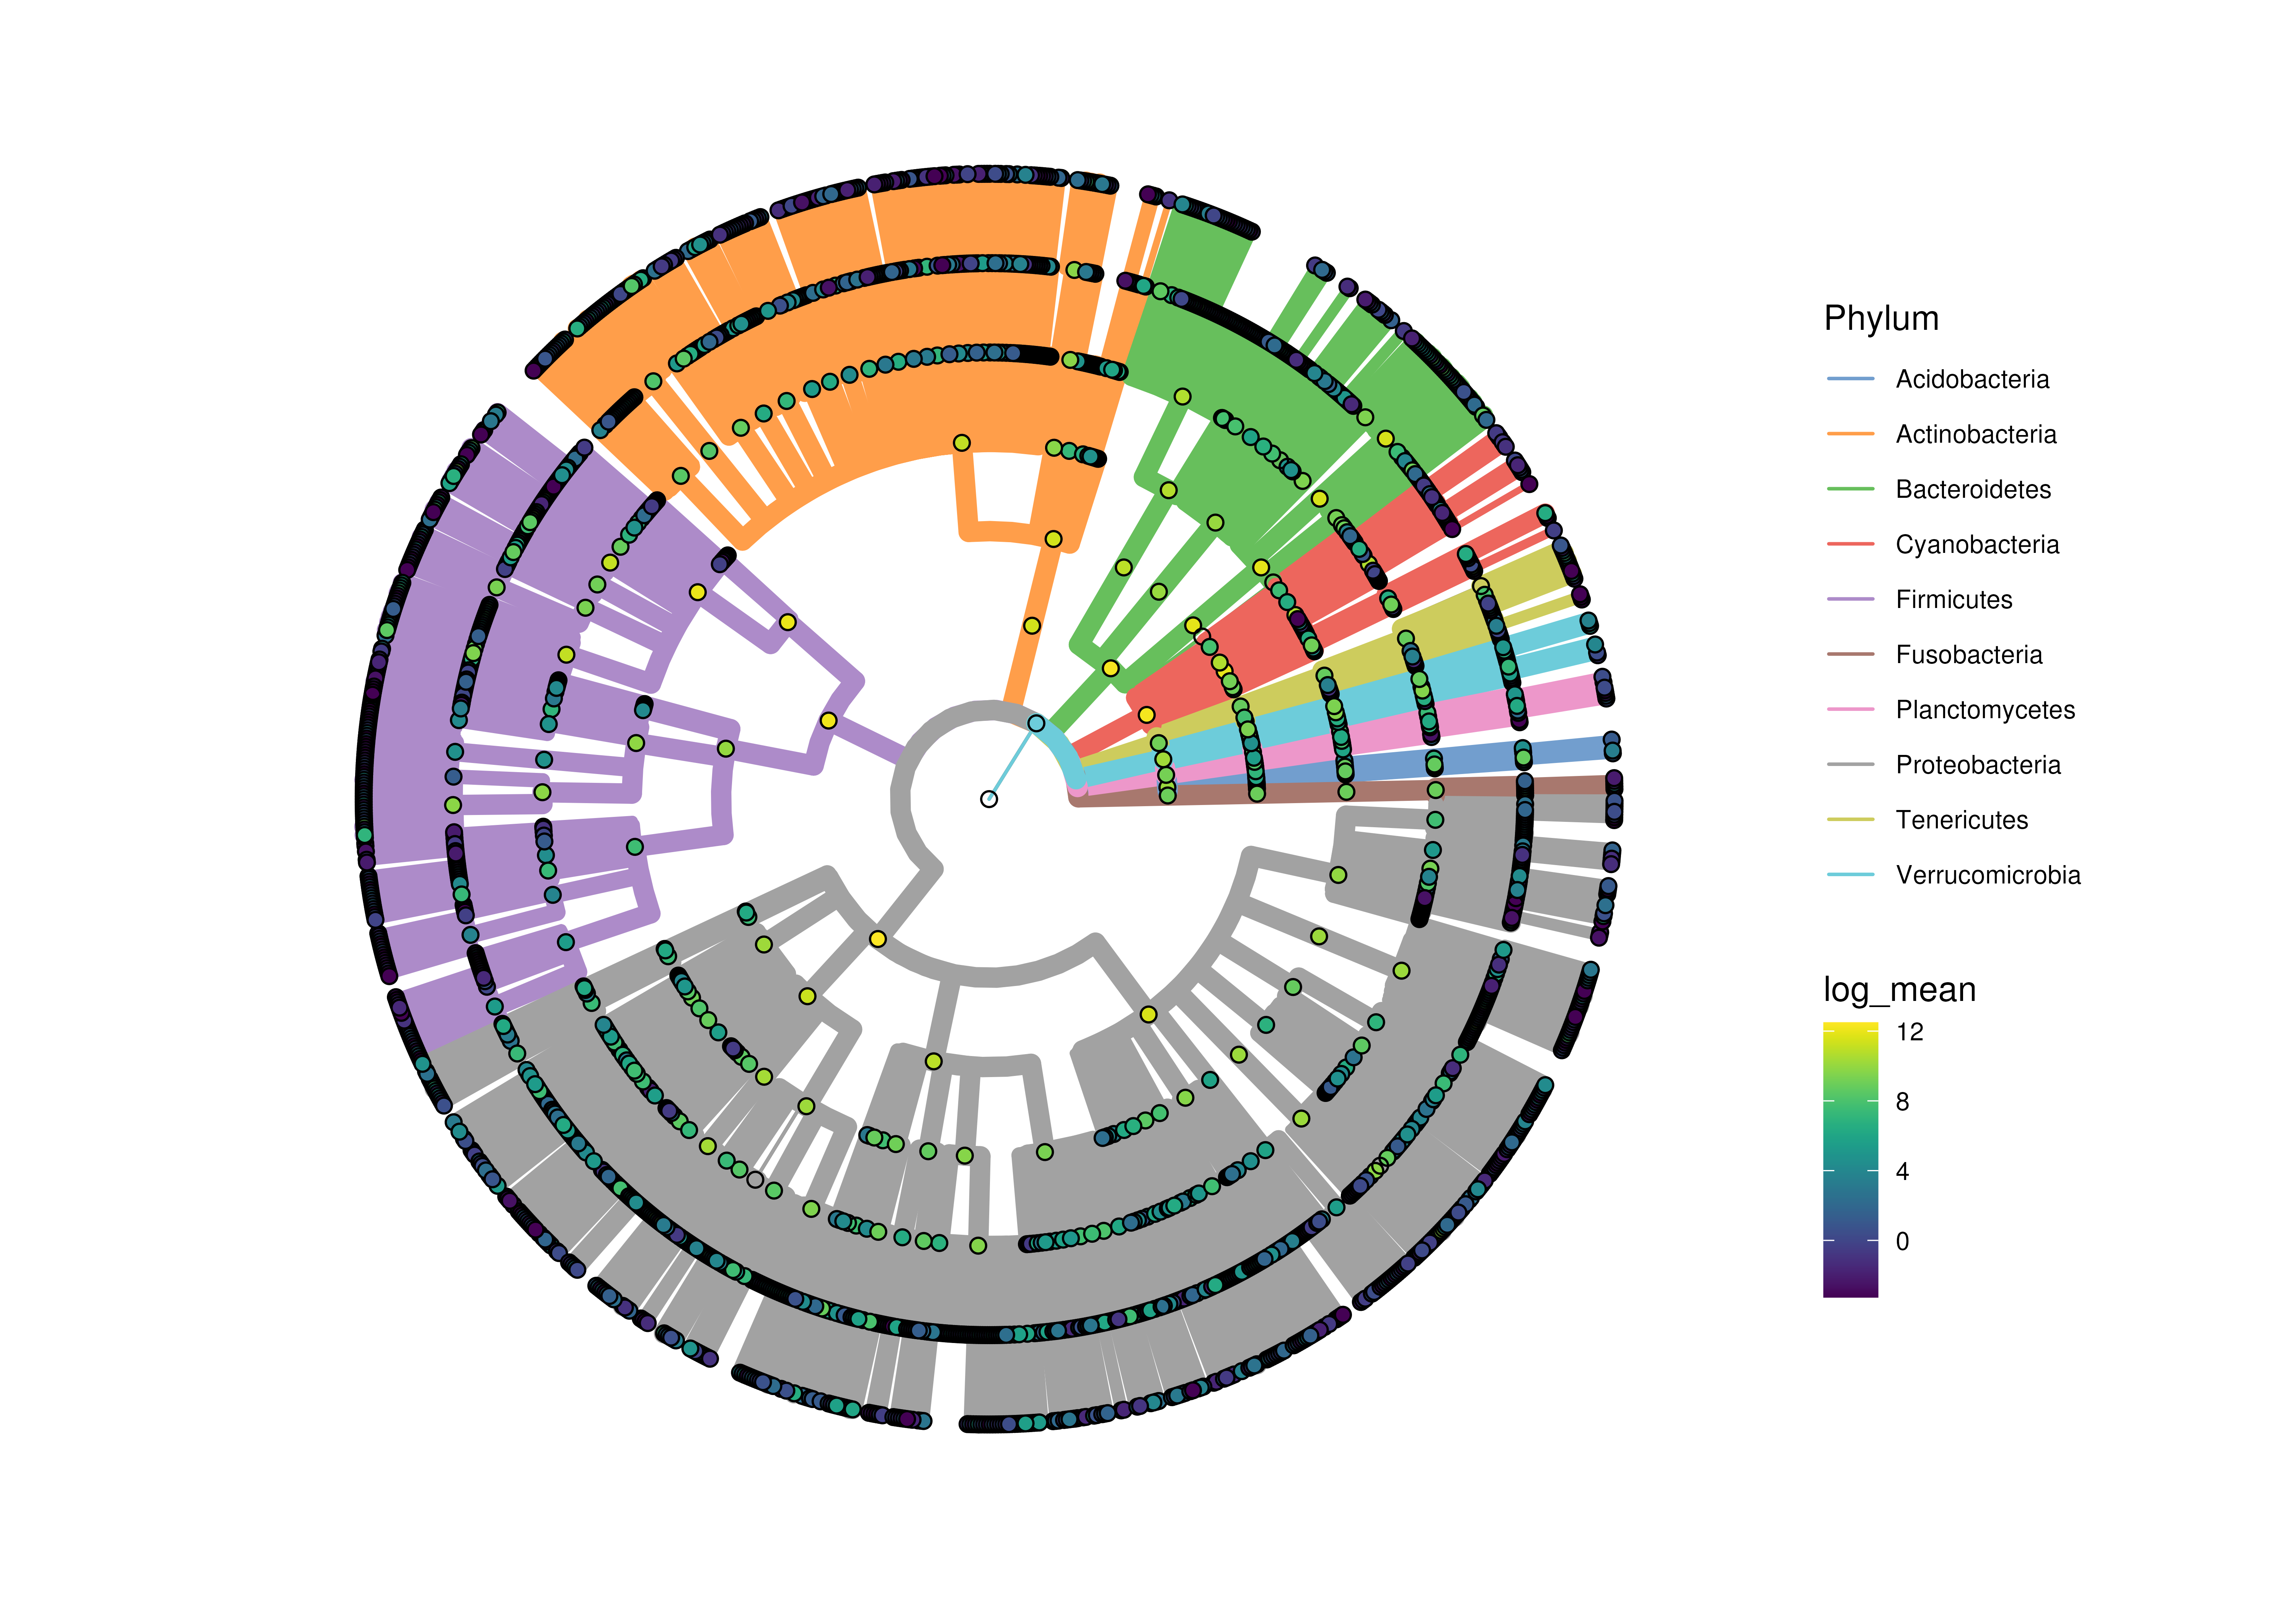
plotRowTree(
x[rowData(x)$Phylum %in% top_phyla,],
tip.colour.by = "log_mean",
node.colour.by = "log_mean",
show.highlights = highlights,
show.highlight.label = highlights,
colour.highlights.by = "Phylum"
)
#> Warning: some tip numbers were larger than the number of tips: they were ignored
#> Warning: 537 row(s) are dropped due to mismatch with nodes of 'value'
#> Warning: `aes_()` was deprecated in ggplot2 3.0.0.
#> ℹ Please use tidy evaluation idioms with `aes()`
#> ℹ The deprecated feature was likely used in the miaViz package.
#> Please report the issue at <https://github.com/microbiome/miaViz/issues>.
# aggregating data over the taxonomic levels for plotting a taxonomic tree
# please note that the original tree of GlobalPatterns is dropped by
# unsplitByRanks
altExps(GlobalPatterns) <- splitByRanks(GlobalPatterns)
#> Duplicated labels were made unique.
#> Duplicated labels were made unique.
top_phyla <- getTop(
altExp(GlobalPatterns,"Phylum"),
method = "mean",
top = 10L,
assay.type="counts"
)
altExps(GlobalPatterns) <- lapply(altExps(GlobalPatterns), addPerFeatureQC)
altExps(GlobalPatterns) <- lapply(
altExps(GlobalPatterns), function(y){
rowData(y)$log_mean <- log(rowData(y)$mean)
rowData(y)$detected <- rowData(y)$detected / 100
return(y)
})
x <- unsplitByRanks(GlobalPatterns)
x <- addHierarchyTree(x)
#> Warning: The root is added with label 'ALL'
highlights <- c(
"Phylum:Firmicutes","Phylum:Bacteroidetes",
"Family:Pseudomonadaceae","Order:Bifidobacteriales")
plotRowTree(
x[rowData(x)$Phylum %in% top_phyla,],
tip.colour.by = "log_mean",
node.colour.by = "log_mean",
show.highlights = highlights,
show.highlight.label = highlights,
colour.highlights.by = "Phylum"
)
#> Warning: some tip numbers were larger than the number of tips: they were ignored
#> Warning: 537 row(s) are dropped due to mismatch with nodes of 'value'
#> Warning: `aes_()` was deprecated in ggplot2 3.0.0.
#> ℹ Please use tidy evaluation idioms with `aes()`
#> ℹ The deprecated feature was likely used in the miaViz package.
#> Please report the issue at <https://github.com/microbiome/miaViz/issues>.
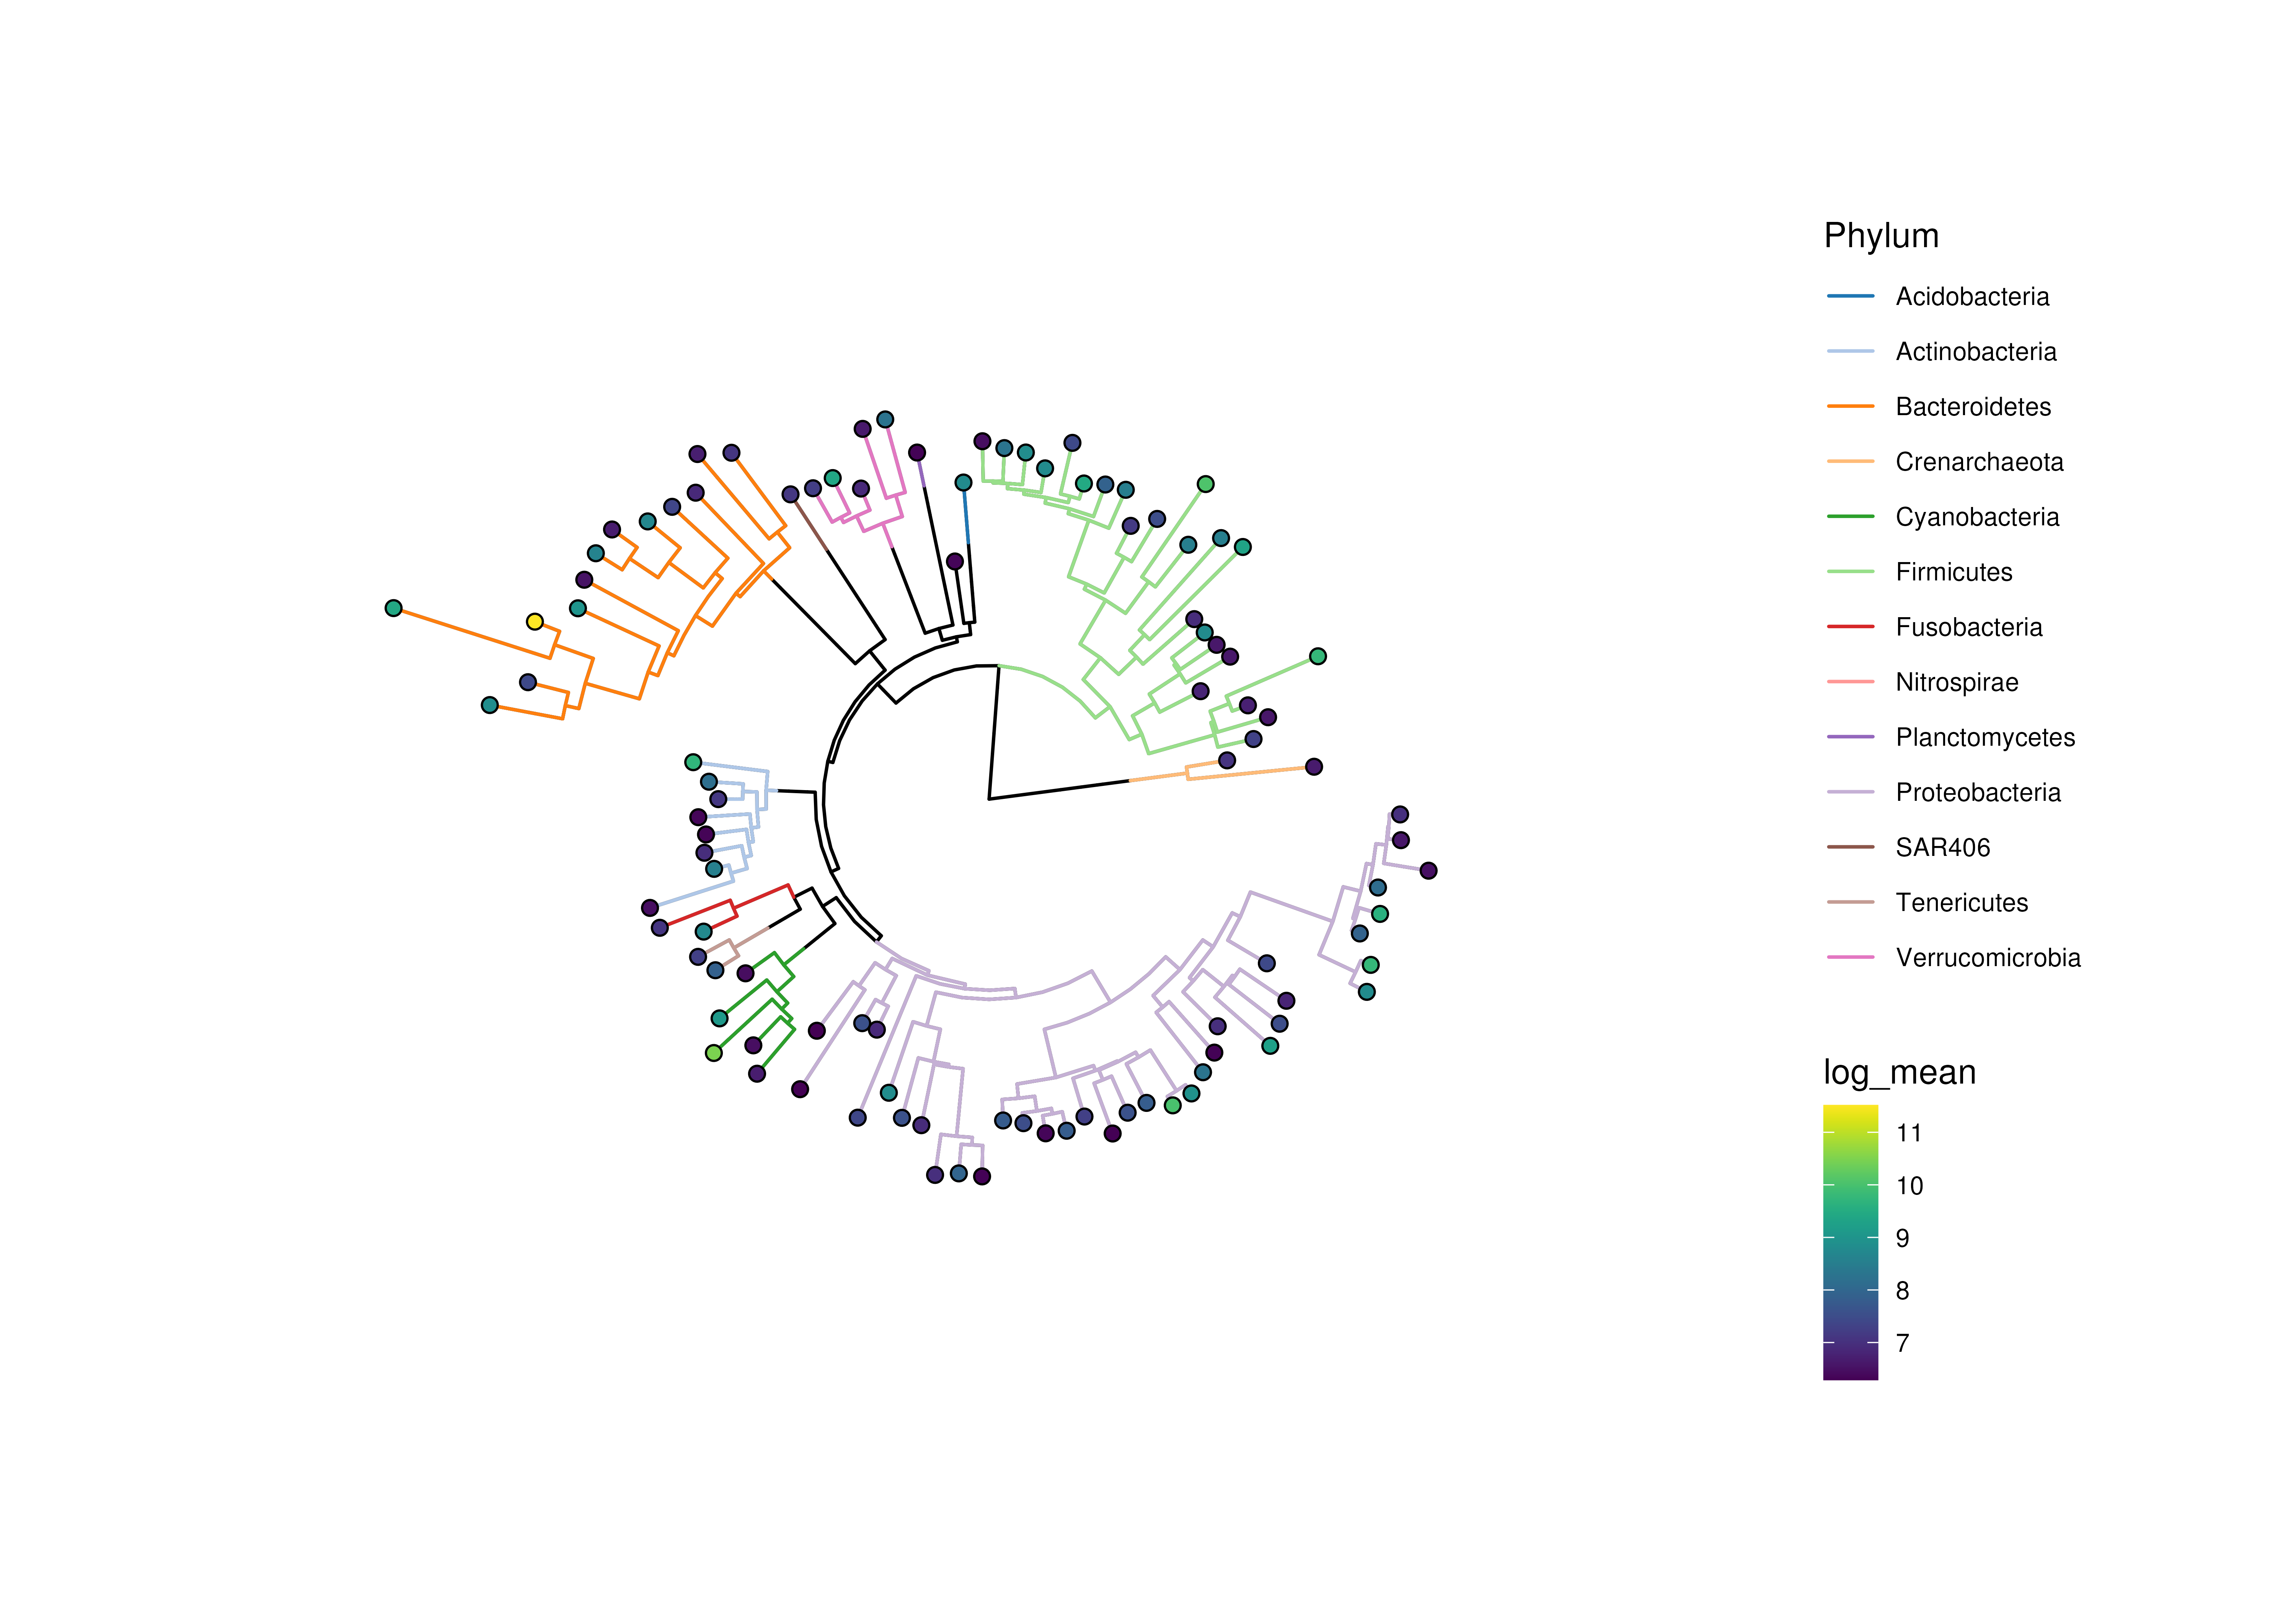
 # If you do not want to show internal nodes
plotRowTree(
x[rowData(x)$Phylum %in% top_phyla,],
edge.colour.by = "Phylum",
edge.size.by = "detected",
node.colour.by = "log_mean",
show.nodes = FALSE
)
#> Warning: some tip numbers were larger than the number of tips: they were ignored
#> Warning: 537 row(s) are dropped due to mismatch with nodes of 'value'
# If you do not want to show internal nodes
plotRowTree(
x[rowData(x)$Phylum %in% top_phyla,],
edge.colour.by = "Phylum",
edge.size.by = "detected",
node.colour.by = "log_mean",
show.nodes = FALSE
)
#> Warning: some tip numbers were larger than the number of tips: they were ignored
#> Warning: 537 row(s) are dropped due to mismatch with nodes of 'value'