
Summary and Schedule
This lesson teaches the basics of microbiome data analysis with R/Bioconductor. Using real data from a study on colorectal cancer, you will learn the typical steps of a microbiome analysis: importing the data, exploring and preparing it, comparing diversity between groups, finding the bacteria that differ between groups, and predicting an outcome from the microbiome with machine learning.
The lesson uses the OMA framework, a family of R/Bioconductor packages for microbiome data science. After the lesson, you can continue learning with the online book Orchestrating Microbiome Analysis (OMA).
Learning objectives
After this lesson, learners will be able to:
| Learning objective | Episode |
|---|---|
| Describe how sequencing reads become the tables we analyse, and how to import them. | From reads to tables |
Import microbiome data into a TreeSummarizedExperiment
object and access its parts. |
Importing data |
| Prepare microbiome data by agglomerating, transforming and filtering taxa. | Exploring and preparing data |
| Calculate alpha diversity and test whether it differs between study groups. | Alpha diversity |
| Interpret beta diversity ordination plots, test differences in community composition between groups, and find groups of similar samples with clustering. | Beta diversity |
| Identify taxa whose abundance or prevalence differs between groups. | Differential abundance |
| Predict an outcome from the microbiome with machine learning and evaluate the prediction. | Machine learning |
| Carry out the whole workflow on a new dataset. | Capstone |
This lesson is a prerequisite for the follow-up multi-omics lesson, which combines the microbiome with other data types, such as metabolites.
Where does this lesson fit?
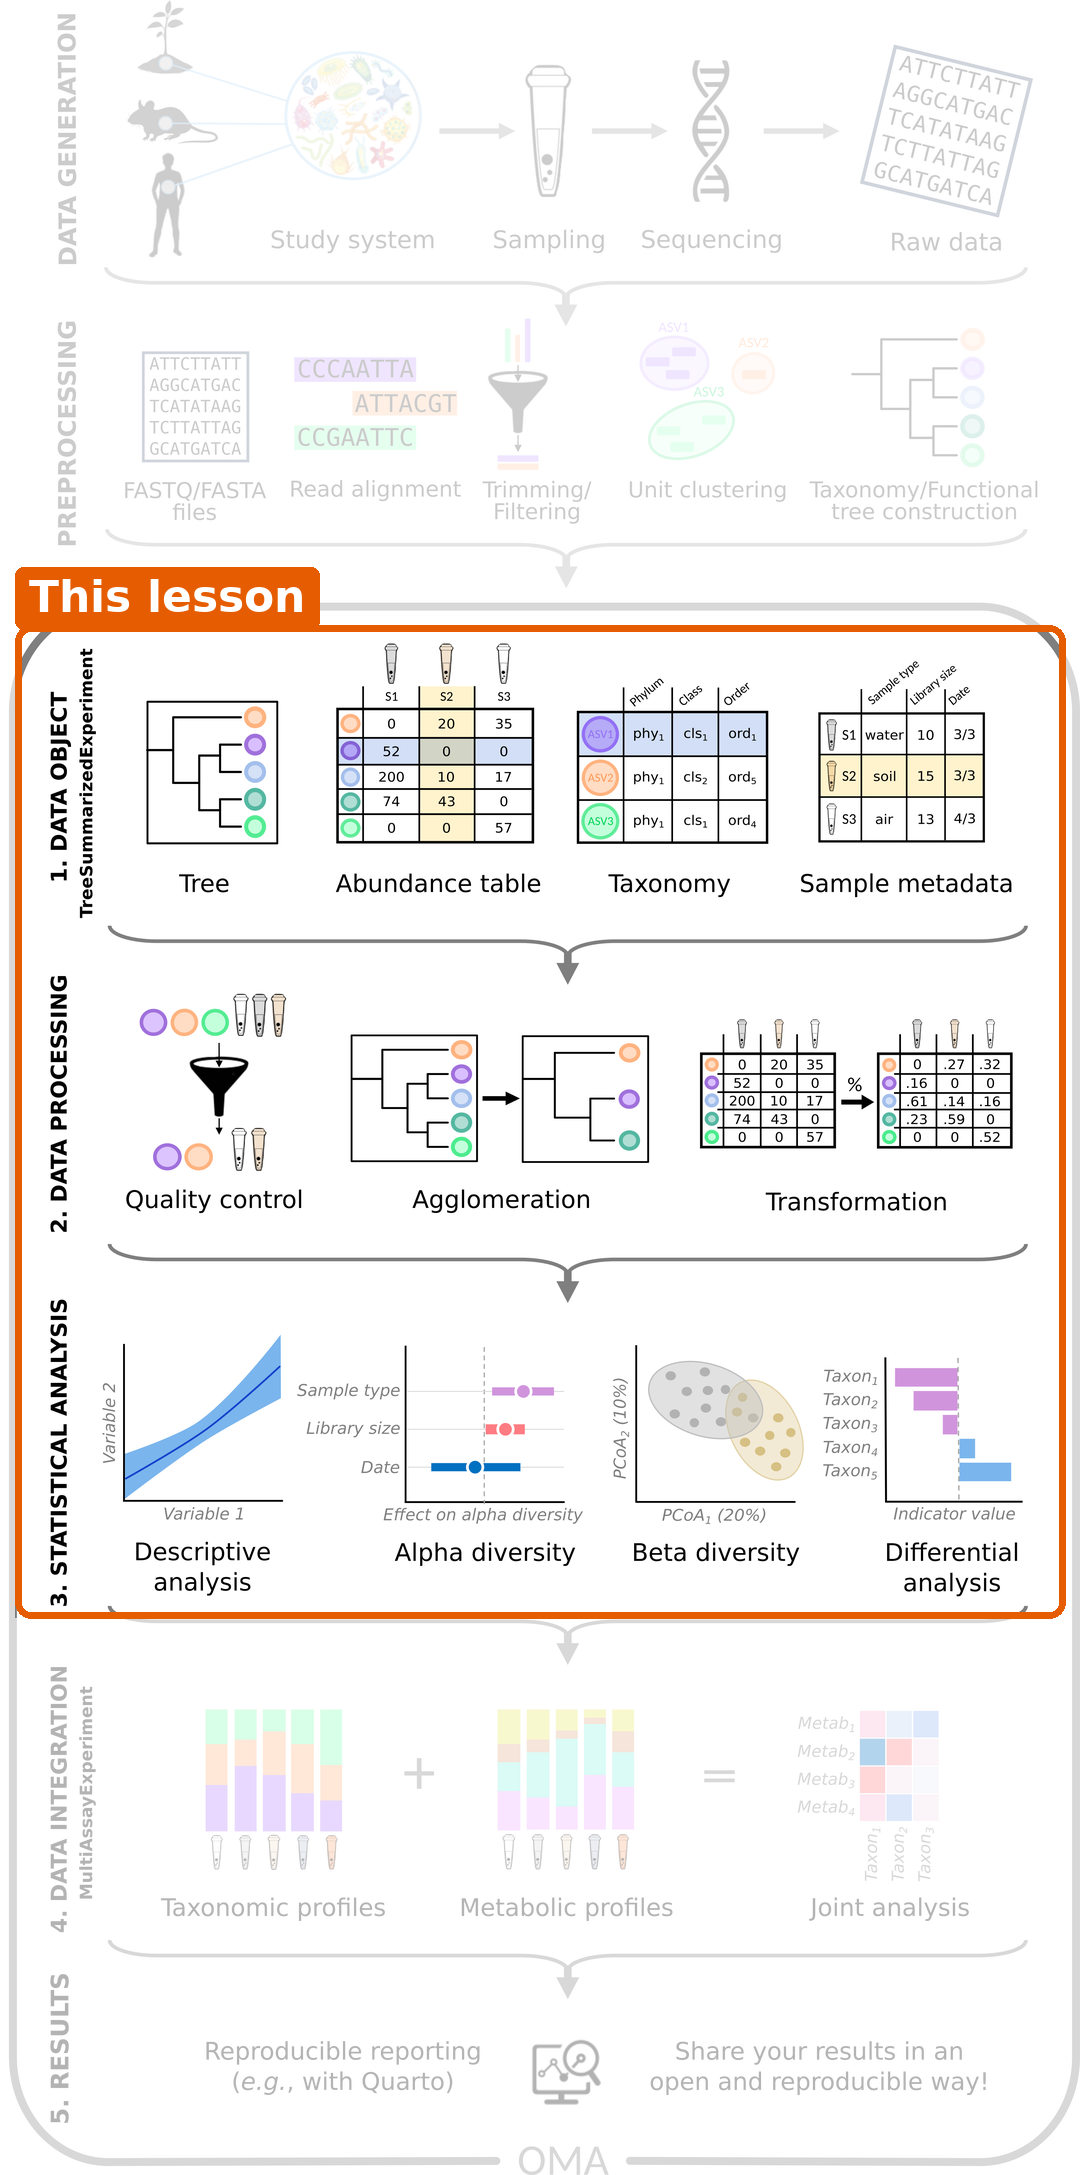
A microbiome study goes from collecting samples and sequencing them, through processing the reads into tables, to analysing the tables. This lesson covers the whole analysis of a single abundance table: storing the data in R, processing it and the statistical analysis. Studies that combine several tables, for example the microbiome and metabolites of the same samples, need data integration methods. They are covered in the multi-omics lesson, which builds on this one.
The data
We analyse stool samples from 60 people in India: 30 people with colorectal cancer and 30 healthy people (Gupta et al. 2019). The samples were sequenced with shotgun metagenomics. The capstone uses a second, small example dataset that comes with the mia package.
Prerequisites
- Basic R programming: data frames, factors, functions and plotting with ggplot2, for example from the Introduction to data analysis with R and Bioconductor lesson.
- Basic statistics: what a p-value is.
- A general idea of what a microbiome is. No experience in microbiome analysis is needed.
| Setup Instructions | Download files required for the lesson | |
| Duration: 00h 00m | 1. Introduction to microbiome data |
What is microbiome data? How is microbiome data produced? What will we learn to do with it in this lesson? |
| Duration: 00h 55m | 2. From samples to tables |
Where do the samples come from, and what should we keep in mind about
them? How do sequencing reads become the tables that we analyse in R? How do I import the output of these pipelines into R? |
| Duration: 01h 35m | 3. RStudio project and experimental data |
How do I organize my work for this lesson? How do I get the data used in this lesson? |
| Duration: 02h 00m | 4. Importing data into TreeSummarizedExperiment |
How do we load microbiome data into R? Why do we store the data in a single object? What is in our study data? |
| Duration: 03h 15m | 5. Exploring and preparing microbiome data |
How deeply was each sample sequenced? How do we look at the data at a higher taxonomic level, such as phylum? Why and how do we transform the counts? Which bacteria dominate the gut of the people in our study? |
| Duration: 05h 25m | 6. Alpha diversity |
What is alpha diversity? How do we calculate alpha diversity? Does alpha diversity differ between people with colorectal cancer and healthy people? |
| Duration: 07h 10m | 7. Beta diversity |
How different are the samples from each other? How can we visualize the differences between many samples? Is the community composition different between people with colorectal cancer and healthy people? (Bonus) Do the samples fall into natural groups? |
| Duration: 09h 54m | 8. Differential abundance and prevalence analysis |
Which bacteria differ in abundance between people with colorectal cancer
and healthy people? Which bacteria are found more often in one group than in the other? Why can we not test every taxon separately with a p-value threshold of 0.05? |
| Duration: 12h 24m | 9. Machine learning: predicting an outcome |
How well can we predict an outcome, such as colorectal cancer, from the
gut microbiome? Why do we split the data into training and test data? Which bacteria are the most important for the prediction? |
| Duration: 13h 59m | 10. Capstone: analyse a new dataset |
Can I run a complete microbiome analysis on my own? How do I report the results of a microbiome analysis? |
| Duration: 14h 59m | 11. Next steps |
What did we learn about our study? Where can I learn more? |
| Duration: 15h 14m | Finish |
The actual schedule may vary slightly depending on the topics and exercises chosen by the instructor.
Software
This lesson uses R and RStudio, together with a few R/Bioconductor packages.
For more detailed instructions, see the setup page of the Introduction to data analysis with R and Bioconductor lesson.
Packages
The lesson uses R packages from Bioconductor and CRAN. We install them in two
steps. Run the commands below in the RStudio console. The installation
can take several minutes. If R asks whether to install a package from
source, you can answer no.
1. Bioconductor and CRAN packages. Bioconductor packages are installed with the BiocManager package, which also installs packages from CRAN. First install BiocManager itself, then the packages:
R
install.packages("BiocManager")

BiocManager::install(c(
    "mia",       # microbiome data analysis
    "miaViz",    # microbiome data visualization
    "scater",    # principal component analysis
    "maaslin3",  # differential abundance analysis
    "bluster",   # clustering
    "mikropml",  # machine learning
    "ape",       # phylogenetic trees
    "remotes"    # installing packages from GitHub (step 2)
))
The lesson needs the current Bioconductor release. You can check your version with:
R
BiocManager::version()
If BiocManager says that your version is out of date, update R to the newest release and run the installation again.
2. A package from GitHub. The daa package, which we use to show the idea of differential abundance analysis, is new and is not yet part of Bioconductor. Packages that are still in development are often shared on GitHub. The remotes package installs them:
R
remotes::install_github("microbiome/daa")
Finally, check that the main packages load and that daa is installed:
R
library(mia)
library(miaViz)
library(maaslin3)
packageVersion("daa")
If these commands run without errors, you are ready. Messages about masked objects are normal.
Problems with the installation?
If a package fails to install, check that your R version is recent
enough with R.version.string, and try the installation
again. If the problem persists, ask for help before the workshop, so
that we can solve it together.
Data
You do not need to download anything in advance. We download the data together in the episode RStudio project and experimental data.