Short term changes in abundance
Source:R/AllGenerics.R, R/getShortTermChange.R
getShortTermChange.RdCalculates short term changes in abundance of taxa using temporal abundance data.
addShortTermChange(x, ...)

getShortTermChange(x, ...)

# S4 method for class 'SummarizedExperiment'
addShortTermChange(x, name = "short_term_change", ...)

# S4 method for class 'SummarizedExperiment'
getShortTermChange(x, time.col, assay.type = "counts", group = NULL, ...)
Arguments
- x
A
SummarizedExperimentobject.- ...
additional arguments.
time.interval:Integer scalar. Indicates the increment between time steps. By default, the function compares each sample to the previous one. If you need to take every second, every third, or so, time step, then increase this accordingly. (Default:1L)
- name
Character scalar. Specifies a name for storing short term results. (Default:"short_term_change")- time.col
Character scalar. Specifies a name of the column fromcolDatathat identifies the sampling time points for the samples.- assay.type
Character scalar. Specifies which assay values are used in the dissimilarity estimation. (Default:"counts")- group
Character scalar. Specifies a name of the column fromcolDatathat identifies the grouping of the samples. (Default:NULL)
Value
getShortTermChange returns DataFrame object containing
the short term change in abundance over time for a microbe.
addShortTermChange, on the other hand, returns a
SummarizedExperiment
object with these results in its metadata.
Details
These functions can be utilized to calculate growth metrics for short term change. In specific, the functions calculate the metrics with the following equations:
$$time\_diff = time_{t} - time_{t-1}$$
$$abundance\_diff = abundance_{t} - abundance_{t-1}$$
$$growth\_rate = abundance\_diff - abundance_{t-1}$$
$$rate\_of\_change = abundance\_diff - time\_diff$$
References
Ji, B.W., et al. (2020) Macroecological dynamics of gut microbiota. Nat Microbiol 5, 768–775 . doi: https://doi.org/10.1038/s41564-020-0685-1
See also
Examples
library(miaTime)
# Load time series data
data(minimalgut)
tse <- minimalgut
# Get relative abundances
tse <- transformAssay(tse, method = "relabundance")
# Calculate short term changes
df <- getShortTermChange(
tse, assay.type = "relabundance", time.col = "Time.hr",
group = "StudyIdentifier")
# Calculate the logarithm of the ratio described in Ji, B.W., et al. (2020)
tse <- transformAssay(
tse, assay.type = "relabundance", method = "log10", pseudocount = TRUE)
#> A pseudocount of 3.52021787110118e-06 was applied.
df <- getShortTermChange(
tse, assay.type = "log10", time.col = "Time.hr", group = "StudyIdentifier")
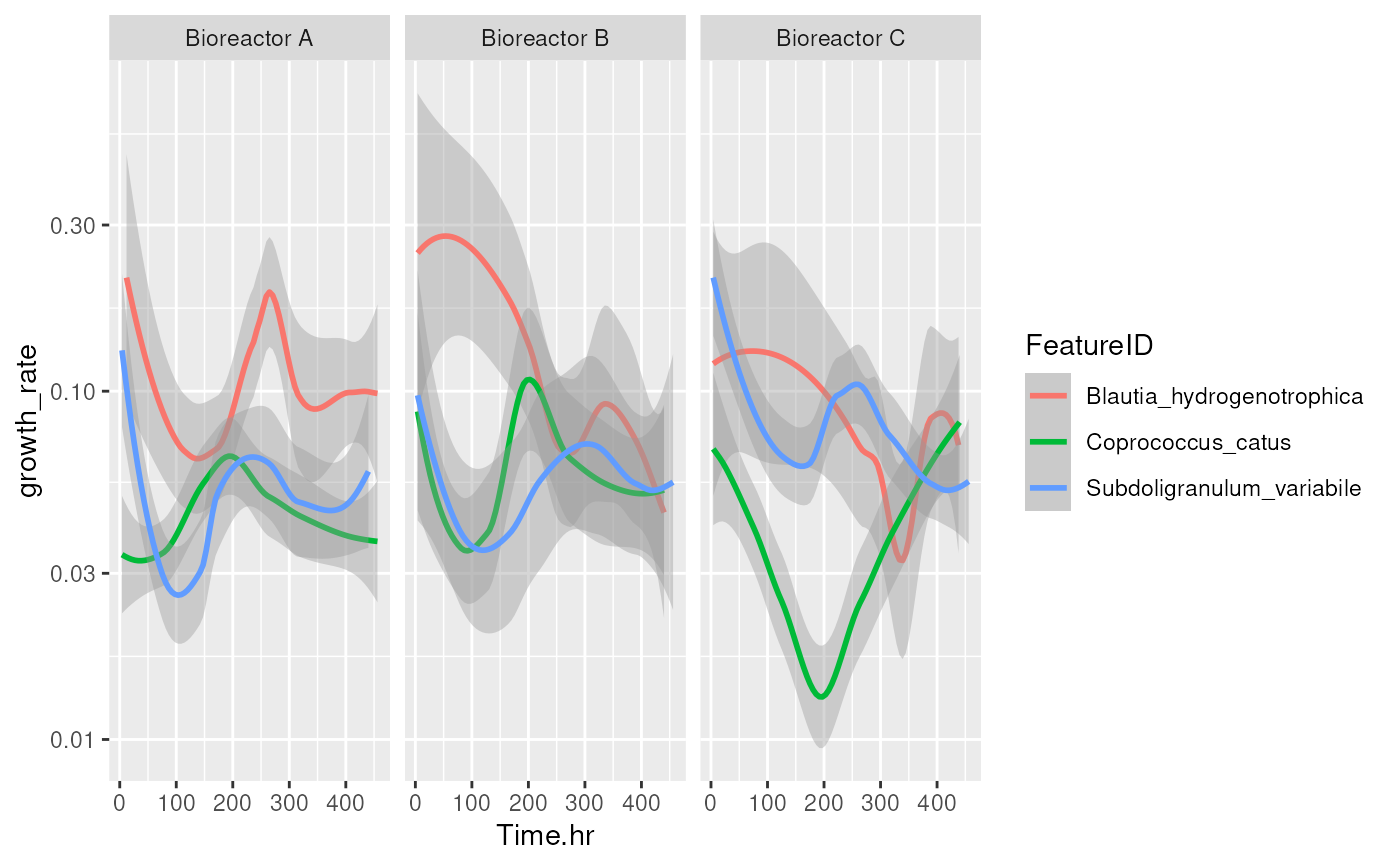
# Select certain bacteria that have highest growth rate
select <- df[["growth_rate"]] |> abs() |> order(decreasing = FALSE)
select <- df[select, "FeatureID"] |> unique() |> head(3)
df <- df[ which(df[["FeatureID"]] %in% select), ]
# Plot results
library(ggplot2)
p <- ggplot(df, aes(x = Time.hr, y = growth_rate, colour = FeatureID)) +
geom_smooth(level = 0.5) +
facet_grid(. ~ StudyIdentifier, scales = "free") +
scale_y_log10()
p
#> Warning: NaNs produced
#> Warning: log-10 transformation introduced infinite values.
#> `geom_smooth()` using method = 'loess' and formula = 'y ~ x'
#> Warning: Removed 310 rows containing non-finite outside the scale range
#> (`stat_smooth()`).