
Introduction to multi-omics
Last updated on 2026-10-13 | Edit this page
Overview
Questions
- What is multi-omics data?
- Why do we study the microbiome with a multi-omics approach?
- Where does multi-omics data come from, and what does that mean for the analysis?
- What kinds of questions can multi-omics methods answer?
Objectives
- Explain what multi-omics data is, using microbiota, metabolites and host biomarkers as an example.
- Give reasons why the microbiome is studied together with other data types, and what a single microbiome table cannot tell.
- Describe how microbiome, metatranscriptomics, metabolomics and host data are generated, and why each data type needs its own preparation.
- Identify problems of study design in a multi-omics study: unmatched samples, batch effects and missing data types.
- Name the three groups of integration methods (exploratory, unsupervised and supervised) and the question each one answers.
Where are we?
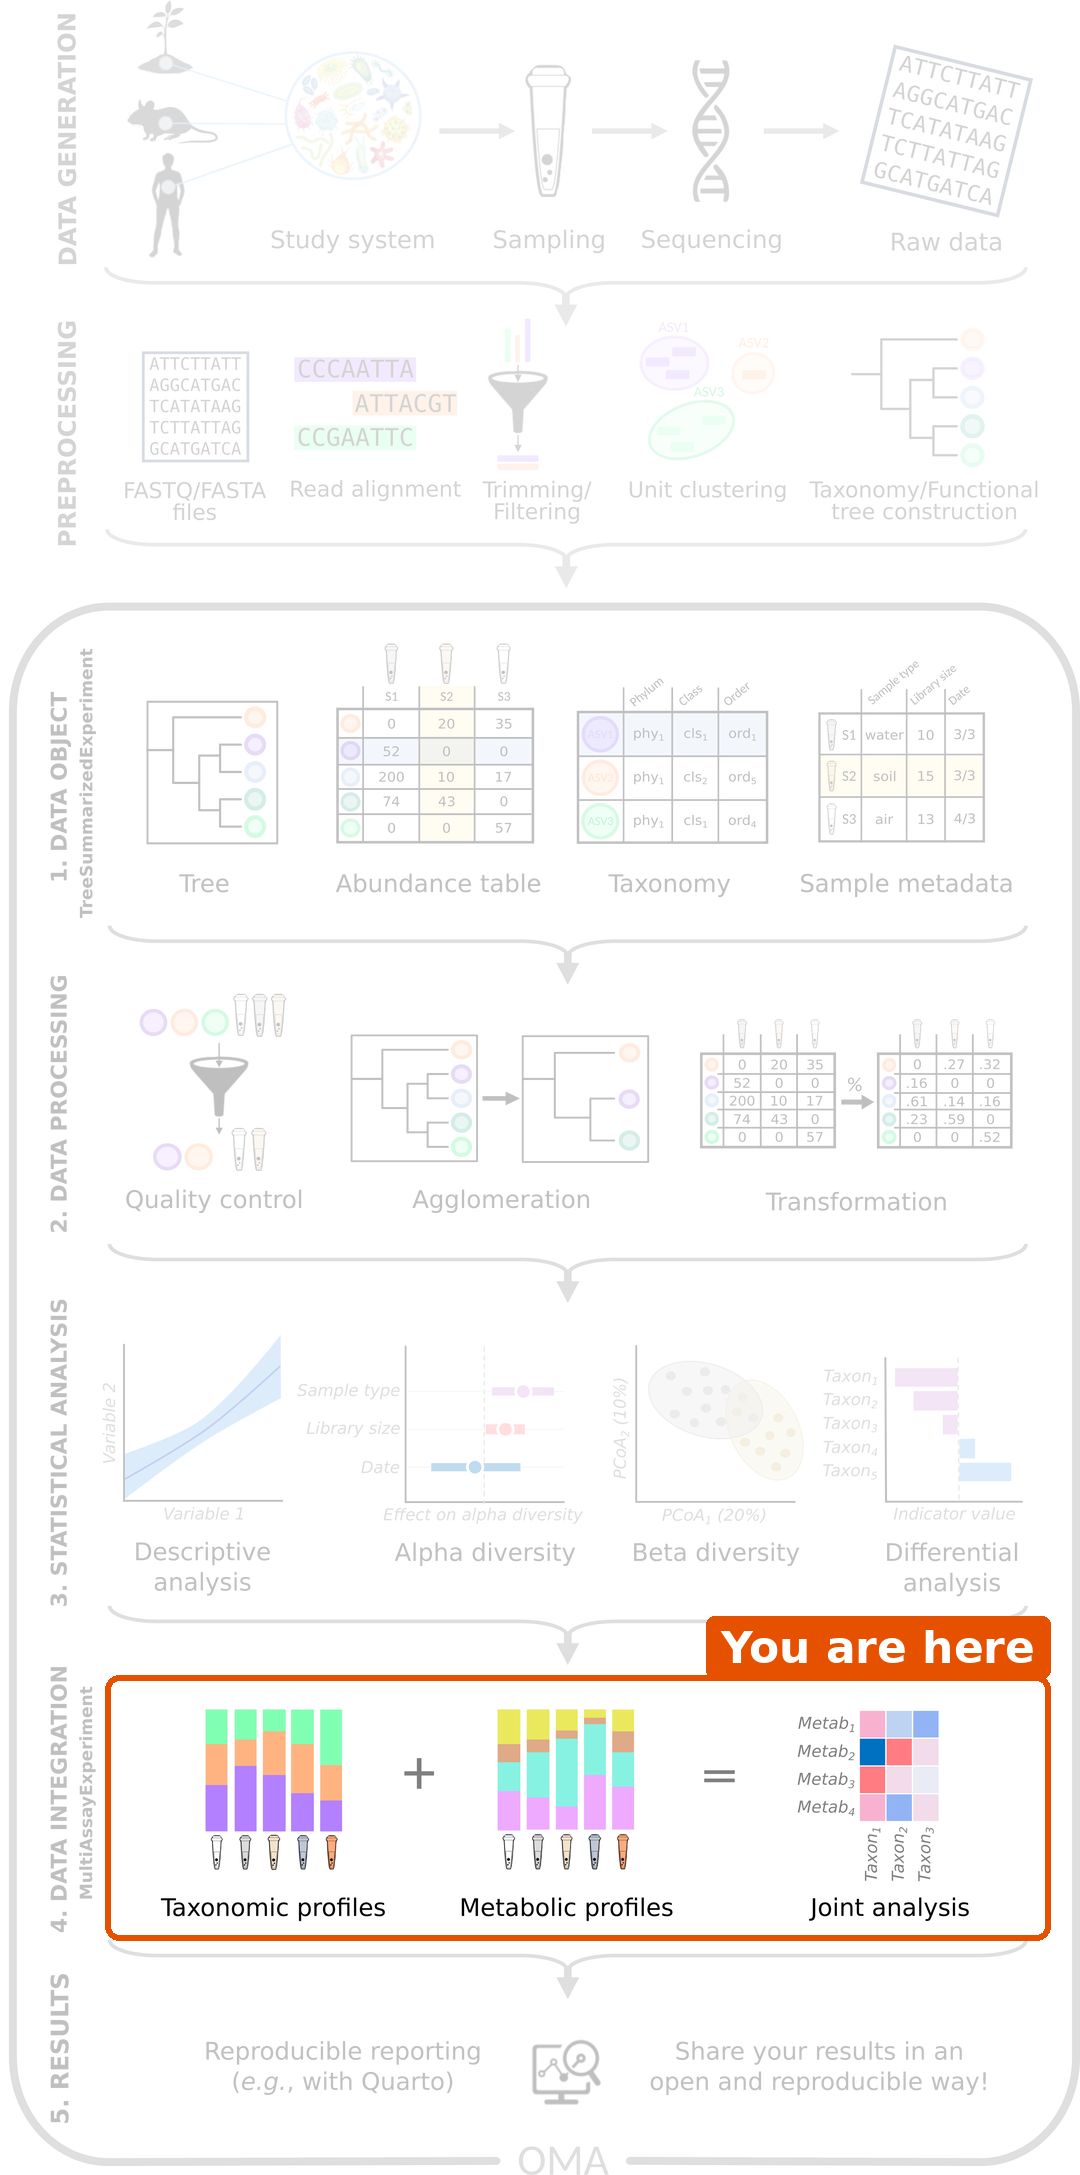
A typical microbiome analysis works with one table: the abundances of taxa in each sample. We import the data, prepare it, and compare diversity and taxa between groups.
This lesson covers the data integration step of the workflow: we combine the microbiome with other data types measured from the same samples, and ask how the data types are related.
Recap: what we assume you know
- A
TreeSummarizedExperiment(TreeSE) stores one table: features (taxa) as rows, samples as columns, sample information incolData()and taxonomy inrowData(). - We agglomerate taxa with
agglomerateByRank(), keep the prevalent ones withsubsetByPrevalent()and transform the counts withtransformAssay(). Microbiome data is compositional, so we use relative abundances or the rclr transformation. - Ordination (PCA, PCoA) shows the main patterns in the samples.
- Machine learning predicts an outcome; we judge a model on test data or with cross-validation, for example with the AUC.
This lesson builds on all of these. They are covered in the microbiome lesson and in the OMA book.
What is multi-omics?
The word omics refers to measuring many molecules of one kind at once: genes (genomics), RNA (transcriptomics), proteins (proteomics) or metabolites (metabolomics). Multi-omics data contains several such data types, all measured from the same samples.
Each data type looks at the samples from a different angle:
| Data type | Question it answers | Example |
|---|---|---|
| Taxonomic profile | Who is there? | Abundance of each bacterial genus |
| Functional profile | What can they do? | Abundance of each metabolic pathway |
| Metatranscriptome | What are they doing now? | Expression of each microbial gene |
| Metabolites | What do they produce? | Concentration of each metabolite |
| Host data | How does the host respond? | Gene expression, immune markers |
By combining the data types, we can ask questions that no single table can answer. For example: which bacteria go together with the short-chain fatty acids in the gut, and are both linked to the health of the host?
Why study the microbiome with multi-omics?
A typical microbiome study finds taxa that differ between healthy people and patients. Such a result raises new questions: what do these bacteria do, and how could they affect the host? A table of taxa cannot answer them, for several reasons:
- Who is there is not what they do. Different bacteria can carry out the same function (functional redundancy), and strains of the same species can carry different genes. Two people with different taxa can have a gut that works in the same way, and two people with the same taxa can differ.
- The microbiome acts through molecules. Gut bacteria affect the host mostly through what they produce or use. For example, bacteria ferment dietary fibre into short-chain fatty acids (SCFA), such as butyrate, which feeds the cells of the gut wall and calms inflammation. Measuring the metabolites shows this activity directly.
- The host is part of the system. The host shapes the microbiome through its diet, immune system and genes, and the microbiome affects the host in return. The host and its microbes are often studied as one system, the holobiont; the study of their genomes and molecules together is called hologenomics.
- Towards mechanisms. A chain such as diet → bacteria → metabolite → host response can only be studied when all its links are measured. Each data type alone gives one link; together, they suggest how the links fit.
- Stronger evidence. A finding that shows up consistently in several data types, measured with different methods, is more convincing than a finding in one table.
Multi-omics does not prove causation on its own: it is still observational data, with the same pitfalls as any observational study. But it narrows down the possible explanations, and points to the experiments worth doing.
Where does the data come from?
How each data type is measured
Each data type comes from its own laboratory method, and the method decides what the numbers mean:
- 16S amplicon sequencing amplifies and sequences one marker gene. It gives read counts of taxa, usually reliable down to the genus.
- Shotgun metagenomics sequences all DNA in the sample. It gives read counts of taxa (often species) and of genes or metabolic pathways: what the microbes can do.
- Metatranscriptomics sequences the RNA of the microbes. It gives read counts of expressed genes: what the microbes are doing at the time of sampling.
- Metabolomics measures small molecules, with nuclear magnetic resonance (NMR) spectroscopy or mass spectrometry (LC-MS, GC-MS). It gives concentrations or intensities of metabolites.
- Host data can be, for example, gene expression of host tissue (RNA-seq) or clinical and lab biomarkers, such as a blood test, each in its own unit.
Before we get the tables, each data type goes through its own preprocessing. Sequencing reads are quality filtered and assigned to taxa or genes. Metabolomics spectra are processed into peaks, and the peaks are identified and quantified. This lesson starts from the finished tables.
Some differences matter for the analysis:
- Counts or concentrations. Sequencing gives counts whose total depends on the sequencing depth, so only the proportions are meaningful (compositional data). Metabolite concentrations and biomarkers are absolute values. The data types therefore need different transformations.
- Skewed values. Counts, concentrations and intensities often have a few very high values. A logarithm makes them closer to normally distributed.
- Targeted or untargeted. Targeted metabolomics measures a chosen list of known metabolites. Untargeted metabolomics measures everything it can detect, including unknown molecules. Untargeted tables have many more features and many more missing values.
-
Missing values. A metabolite below the
detection limit of the instrument is often reported as
missing (
NA). Such a value is not unknown: it is small. A value that is missing because a measurement failed is different, and must not be replaced with a small number.
Tables from the same reads
Some multi-omics tables come from different measurements, for example DNA sequencing of stool and NMR spectroscopy of the same stool. Others are computed from the same sequencing reads: shotgun metagenomics gives both taxa (for example with MetaPhlAn) and genes or metabolic pathways (for example with HUMAnN). Such tables are strongly related by construction: a pathway is abundant because the taxa that carry it are abundant. They are still useful, but remember this when you interpret the results.
Planning a multi-omics study
Matching the samples
To combine the data types, we must know which measurements belong together. They can come from:
- the same sample, for example DNA and metabolites from the same gut content;
- the same subject, but different samples, for example stool for the microbiome and blood for the biomarkers;
- the same subject at different time points, for example before and after a diet.
In the next episode, we will see how R keeps track of this.
Batches, missing data and sample size
Plan a multi-omics study before you collect the samples:
- Batch effects. Samples measured on different days or runs can differ for technical reasons. Mix the study groups across the batches, so that the batch is not confounded (mixed up) with the groups.
- Missing data types. Some samples fail in one of the measurements. Most integration methods use only the samples that have all data types.
- More samples. Multi-omics data has many features and usually few samples. Integration methods usually need more samples than the analysis of a single table.
Three groups of integration methods
There are many multi-omics methods. In this lesson, we group them by the question they answer:
| Group | Question | Methods in this lesson | Episode |
|---|---|---|---|
| Exploratory | Are the data types related, and which features go together? | Mantel test, MiRKAT, pairwise association | Exploratory methods |
| Unsupervised | What are the main patterns that the data types share? | Joint RPCA, MOFA | Unsupervised methods |
| Supervised | Can we predict an outcome from all data types, and which features predict it? | IntegratedLearner, DIABLO | Supervised methods |
Unsupervised methods do not know the study groups: they look for patterns in the data alone, like a PCA or PCoA of a single table. Supervised methods are given an outcome, such as the diet, and look for the features that predict it, like machine learning on a single table.
Before any of this, we need to store the data types together. That is the topic of the next episode.
Challenge 1: Which group of methods?
A study measured the gut bacteria, the gut metabolites and blood biomarkers of mice that were fed a high-fat or a low-fat diet. Which group of methods from the table above would you use for each question?
- Are the gut bacteria related to the metabolites in the gut at all?
- We want one figure that shows how the mice differ, based on all three data types, without telling the method which diet each mouse had.
- Can we tell from the bacteria and the metabolites which diet a mouse had, and which features tell it?
- Which bacterial genera go together with butyrate, a short-chain fatty acid?
- Exploratory, for example the Mantel test.
- Unsupervised, for example MOFA or joint RPCA.
- Supervised, for example IntegratedLearner or DIABLO.
- Exploratory: pairwise associations between butyrate and every genus.
Challenge 2: Beyond the taxa
A microbiome study found that the genus Faecalibacterium is less abundant in people with inflammatory bowel disease (IBD) than in healthy people.
- Which question from the first table (who, what can they do, what do they produce, how does the host respond) does this result answer?
- Which other data types would you measure to find out how the genus could matter for the disease? What would each of them tell?
- Why would a result that is consistent across these data types be more convincing than the taxa alone?
- Who is there.
- For example: a functional profile from shotgun metagenomics (do the bacteria of patients carry fewer genes for butyrate production?), metabolomics of stool (is there less butyrate?), and host data such as inflammation markers in blood or gut tissue (is lower butyrate linked to more inflammation?). Together, they test the chain bacterium → metabolite → host.
- Each data type is measured with a different method and has its own errors. When several of them point to the same explanation, chance and technical artefacts become less likely. It is still not proof of cause, but it points to the experiment worth doing next.
Challenge 3: Plan the preparation
A study has stool and blood samples from 100 people. The stool was sequenced with shotgun metagenomics and measured with untargeted mass spectrometry metabolomics. The blood was used for clinical biomarkers.
- Which of the tables are compositional? Why does this matter when you choose how to transform them?
- Many metabolite values are missing. When is it reasonable to replace them with a small value?
- Do the microbiome and the biomarkers come from the same sample?
- The metabolomics was run in two batches: the first 50 people were healthy, the last 50 were patients. What is the problem?
- Only the taxa are compositional: their total depends on the sequencing depth, so only the proportions are meaningful. They need a compositional transformation, such as relative abundance or rclr. The metabolites and the biomarkers are absolute values, so they are transformed in other ways, for example with a logarithm or standardization.
- When they are missing because they were below the detection limit. Then the true value is small. If a measurement failed, the value is unknown.
- No. They come from the same person, but from different samples (stool and blood).
- The batch is confounded with the health status. A difference between the batches cannot be told apart from a difference between healthy people and patients. The groups should be mixed across the batches.
- Multi-omics data contains several data types measured from the same samples. Each data type looks at the samples from a different angle.
- A table of taxa tells who is there, but not what the bacteria do or how the host responds. Multi-omics links the microbiome to its functions, its metabolites and the host, and points towards mechanisms.
- Each data type is generated with its own method, and needs its own preparation. Microbiome counts are compositional; metabolites and biomarkers are not.
- Tables computed from the same reads, such as taxa and pathways, are related by construction.
- Multi-omics studies need matched samples, groups mixed across batches, and enough samples with all data types.
- Exploratory methods test whether the data types are related, unsupervised methods find shared patterns, and supervised methods predict an outcome from all data types.