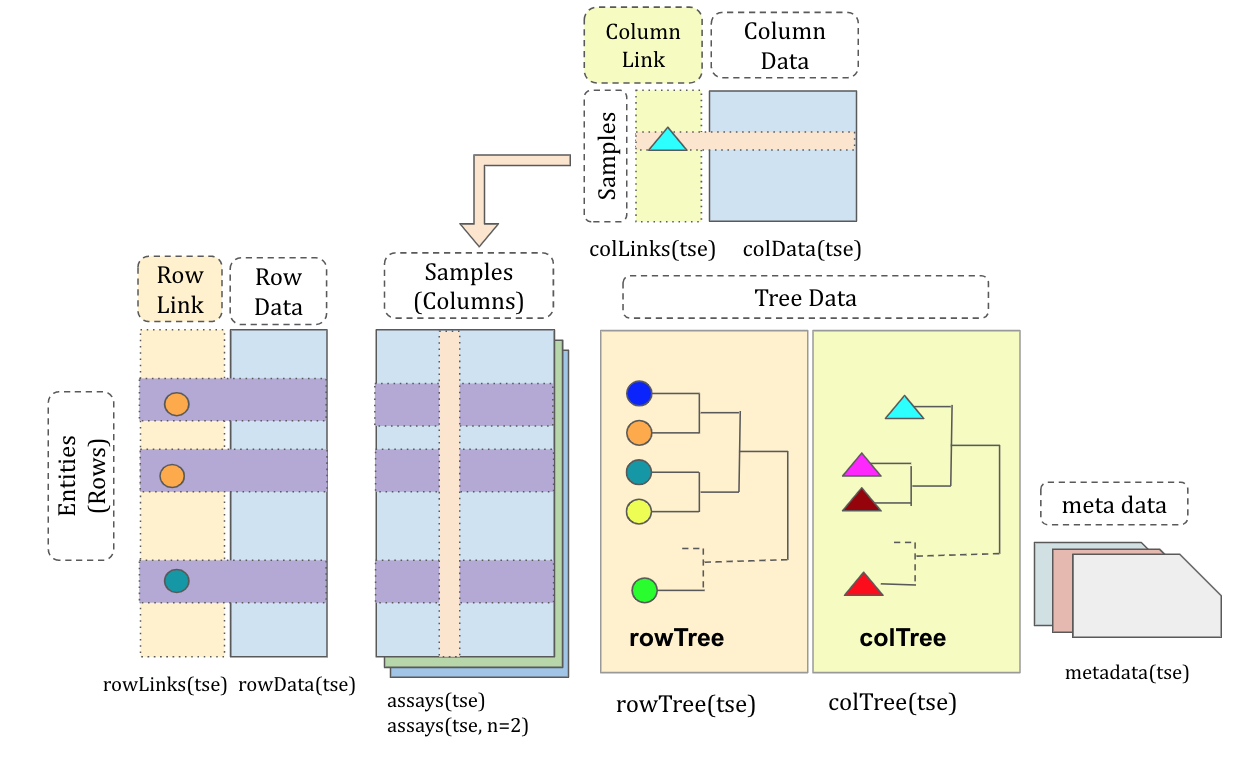
TreeSummarizedExperiment
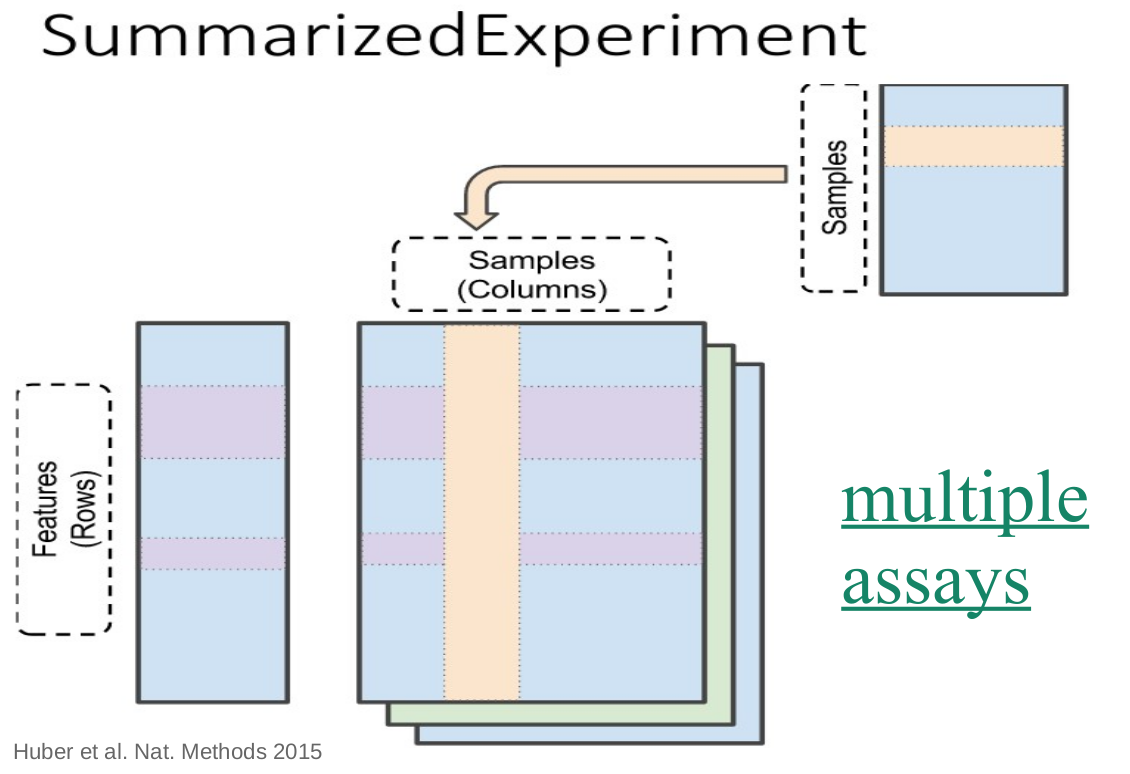
SummarizedExperiment
TreeSummarizedExperiment
Huang et al. F1000, 2021
Alternative data container: phyloseq
Current standard for (16S) microbiome bioinformatics in R (J McMurdie, S Holmes et al.)

Data import from source files
Construct a new TreeSE object from scratch, starting from original data files.
Taxonomic profiling from 40 rat Cecum samples including 12706 OTUs from 318 species
Diet comparison with High/Low fat diet and xylo-oligosaccaride supplementation.

International Journal of Environmental Research and Public Health 18(8):4049 https://doi.org/10.3390/ijerph18084049
Assays & transformations


Normalizing library size?
Bias in compositional data:
- If sample A has been sampled deeper than sample B, also the counts can be expected to be higher.
Possible solutions:
Divide by the total number of reads per sample (compositional abundance)
Rarify (subsample) to even sampling depth
→ Problem: Abundant taxa may distort the ratios

Relative vs. absolute abundances
-> Compositional data analysis (CoDa)

Vandeputte et al. Nature 551:507-511, 2017
RMP vs. QMP
Potentially drastic effect on conclusions!

Vandeputte et al. Nature 551:507-511, 2017
Abundance along the community landscape

Vandeputte et al. Nature 551:507-511, 2017
Aitchison transformations (e.g. CLR)
Aitchison transformations are used to reduce compositional bias.
Balances, or ratios between taxa abundances, are conserved in compositional transformation: \(\frac{x}{y} = \frac{cx}{cy}\)

Phylogenetic transformations
- - there exists no single taxonomic resolution at which taxonomic variation unambiguously reflects functional variation, and at which environmental selection of certain functions - - unambiguously translates to a selection of specific taxa (Louca et al. 2018).


Phylogenetic balances: phILR transformation


Phylogenetic balances as features for FLI predictions
(Based on phILR; Silverman et al. 2017)
Pathways in representative bacterial genomes of Clostridium subclusters IV and XIVa indicated the presence of e.g., ethanol fermentation pathways → endogenous ethanol producers associated with fatty liver?
In addition to age and sex, the models included differences in 11 microbial groups from class Clostridia, mostly belonging to orders Lachnospirales and Oscillospirales. Previously NAFLD-associated Clostridia XIVa group members were detected. Two species in Clostridia IV group were not previously associated with fatty liver disease.
Key associations validated in another Finnish cohort (N=258).

