
Next steps
Last updated on 2026-10-20 | Edit this page
Overview
Questions
- What did we learn about our study?
- Where can I learn more?
Objectives
- Summarize the analysis workflow of this lesson.
- Find resources for further learning.
What we did
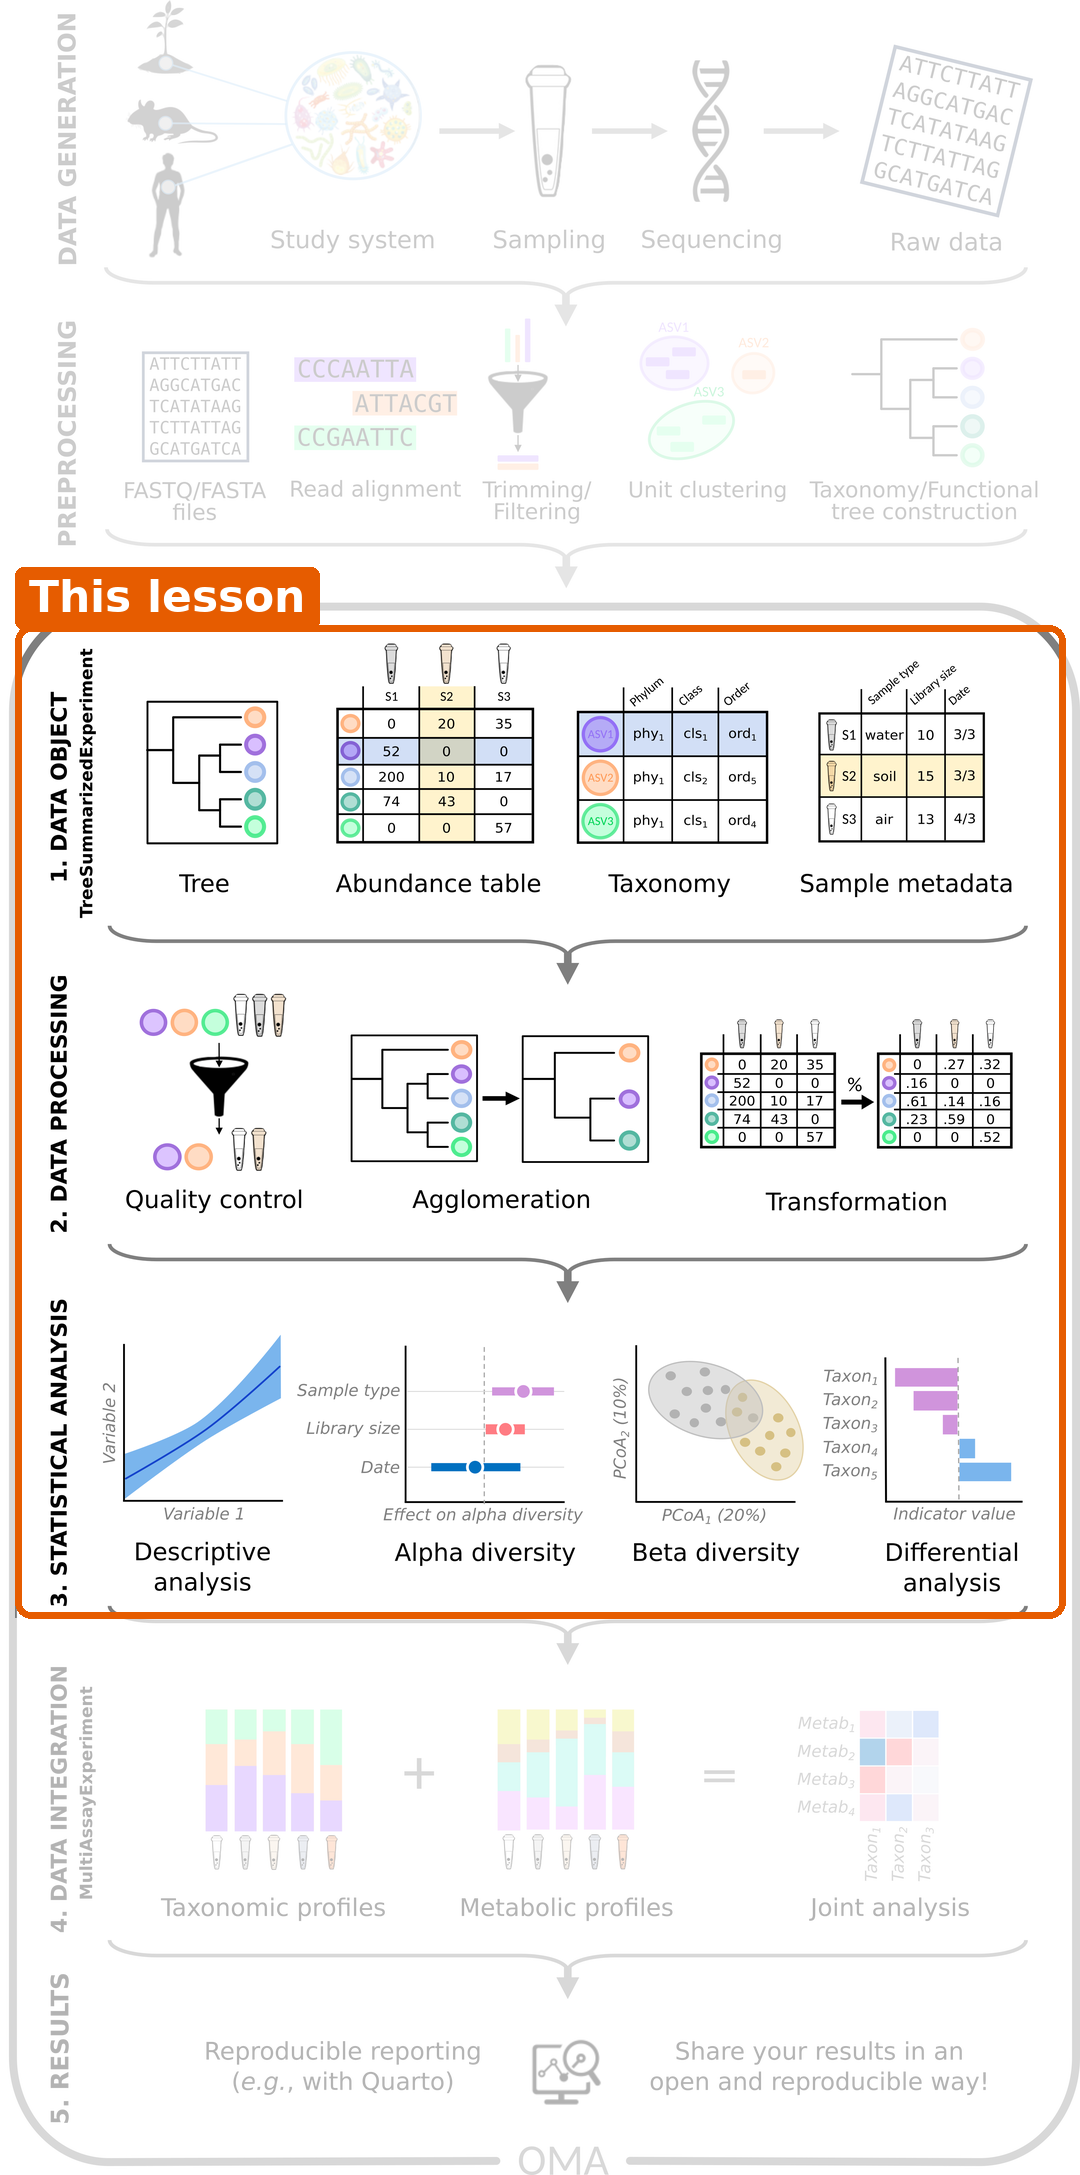
We have gone through the data object, data processing and statistical analysis steps of the microbiome data science workflow. We started with one question: is the gut microbiome of people with colorectal cancer different from that of healthy people, and which bacteria differ? Step by step, we found an answer:
| Episode | Step | What we learned about the study |
|---|---|---|
| 4 | Import | The data fits into one TreeSummarizedExperiment. Most
healthy people come from Bhopal. |
| 5 | Explore and prepare | Library sizes differ between samples. Prevotella dominates many healthy samples. |
| 6 | Alpha diversity | CRC patients have higher diversity, partly because many healthy samples are dominated by Prevotella and are therefore less even. |
| 7 | Beta diversity and clustering | The overall composition of the two groups differs, also when the location is taken into account. The samples fall into a Prevotella and a non-Prevotella community type. |
| 8 | Differential abundance and prevalence | Several species differ. Prevotella copri and butyrate producers such as Faecalibacterium prausnitzii are less abundant in CRC. Others differ in how often they are present, for example Flavonifractor plautii, which is found much more often in CRC. Others differ in how often they are present, for example Flavonifractor plautii, which is found much more often in CRC. |
| 9 | Machine learning | The microbiome predicts CRC well, but with only 60 people the estimate is uncertain and an independent cohort is needed. |
| 10 | Capstone | The same workflow works on a new dataset, even when it finds few differences. |
The same workflow works for most microbiome studies: import the data, explore and prepare it, analyse alpha diversity, beta diversity and differential abundance, and then go further with clustering, machine learning or multi-omics.
Where to go next
This lesson covered the basics. The online book Orchestrating Microbiome Analysis (OMA) goes deeper into each topic and covers many more. Good places to continue:
- Your own data: importing data from QIIME 2, MetaPhlAn, mothur, BIOM files and phyloseq objects (Import chapter).
- More about each step: quality control, other transformations, other diversity indices and distances, rarefaction, other differential abundance methods, and other clustering and machine learning methods.
-
Multi-omics: combining the microbiome with other
data types, such as metabolites, is the topic of the follow-up multi-omics
lesson. It covers
MultiAssayExperiment, exploratory methods (Mantel test, MiRKAT, pairwise associations), unsupervised methods (joint RPCA, MOFA) and supervised methods (IntegratedLearner, DIABLO). - Your own analysis: apply the workflow to your own data, and report it in a reproducible way, for example with Quarto.
Other resources:
- OMA framework: the R/Bioconductor packages for microbiome data science.
- Training slides: slides on many microbiome analysis topics.
-
Bioconductor support
site: ask questions about Bioconductor packages, using the tags
miaormiaViz.
- A typical microbiome analysis goes from import and preparation to alpha diversity, beta diversity and differential abundance.
- These three analyses are what most studies report. They are sometimes enough on their own, and they are always the first steps before more advanced analyses.
- The OMA book is the place to continue learning, and the follow-up multi-omics lesson shows how to combine the microbiome with other data types.